Temperature and Salinity at Depth Levels
Goals of this notebook:
serve as an example of how to post-process CESM/MOM6 output;
create time averages of T/S fields at depth levels and compared agains observations (WOA18).
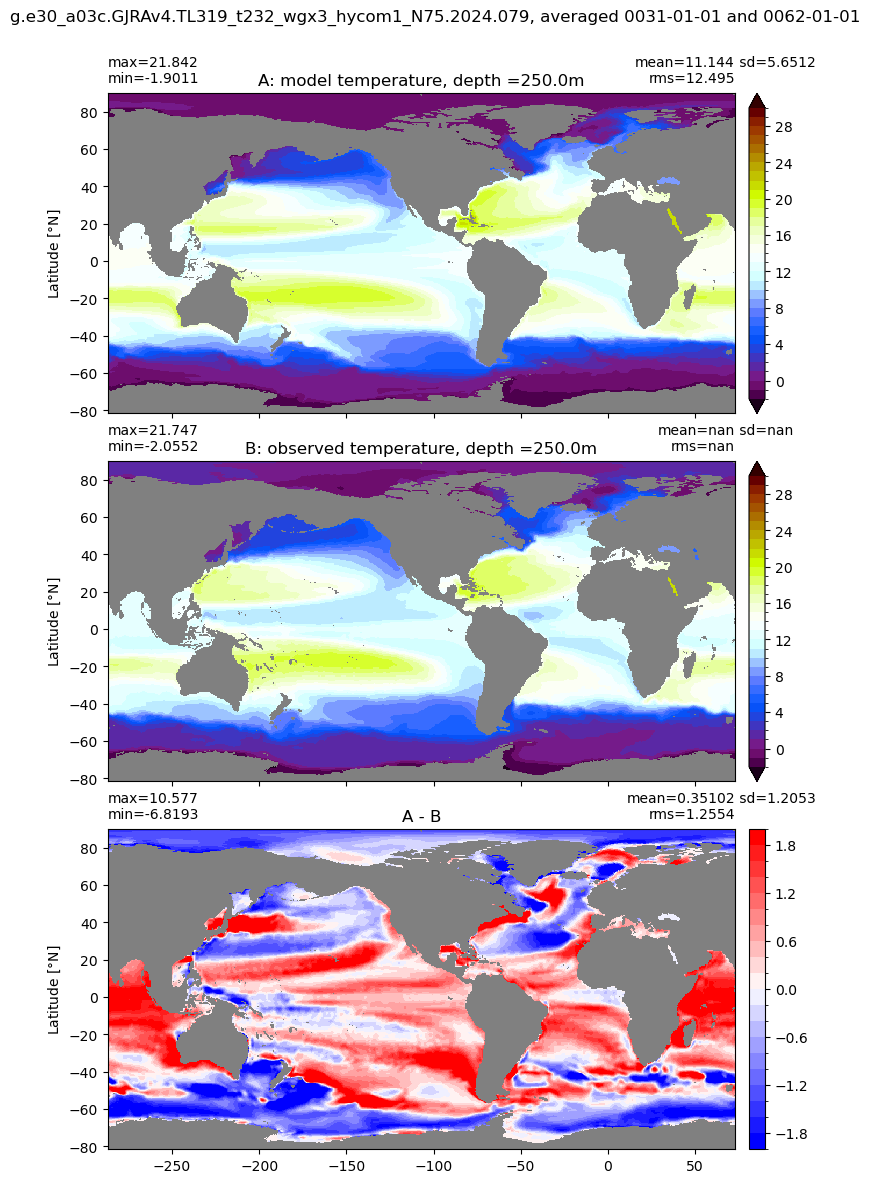
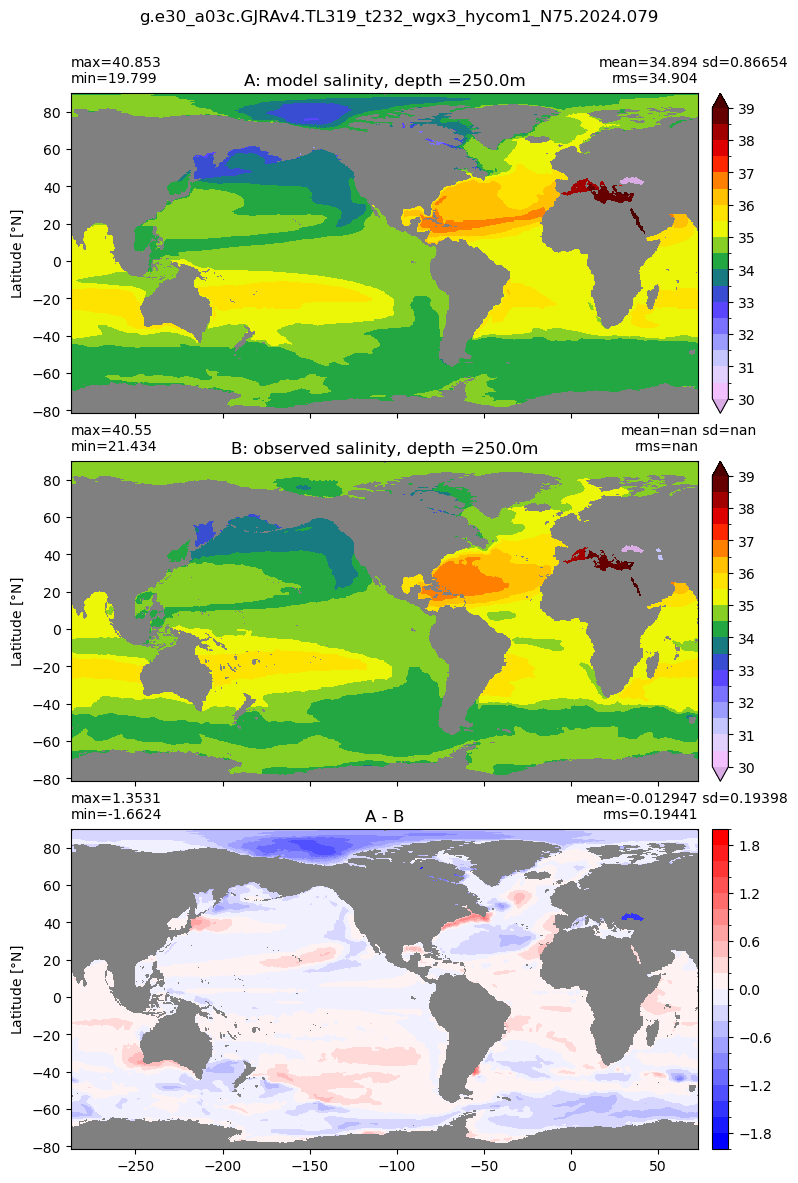
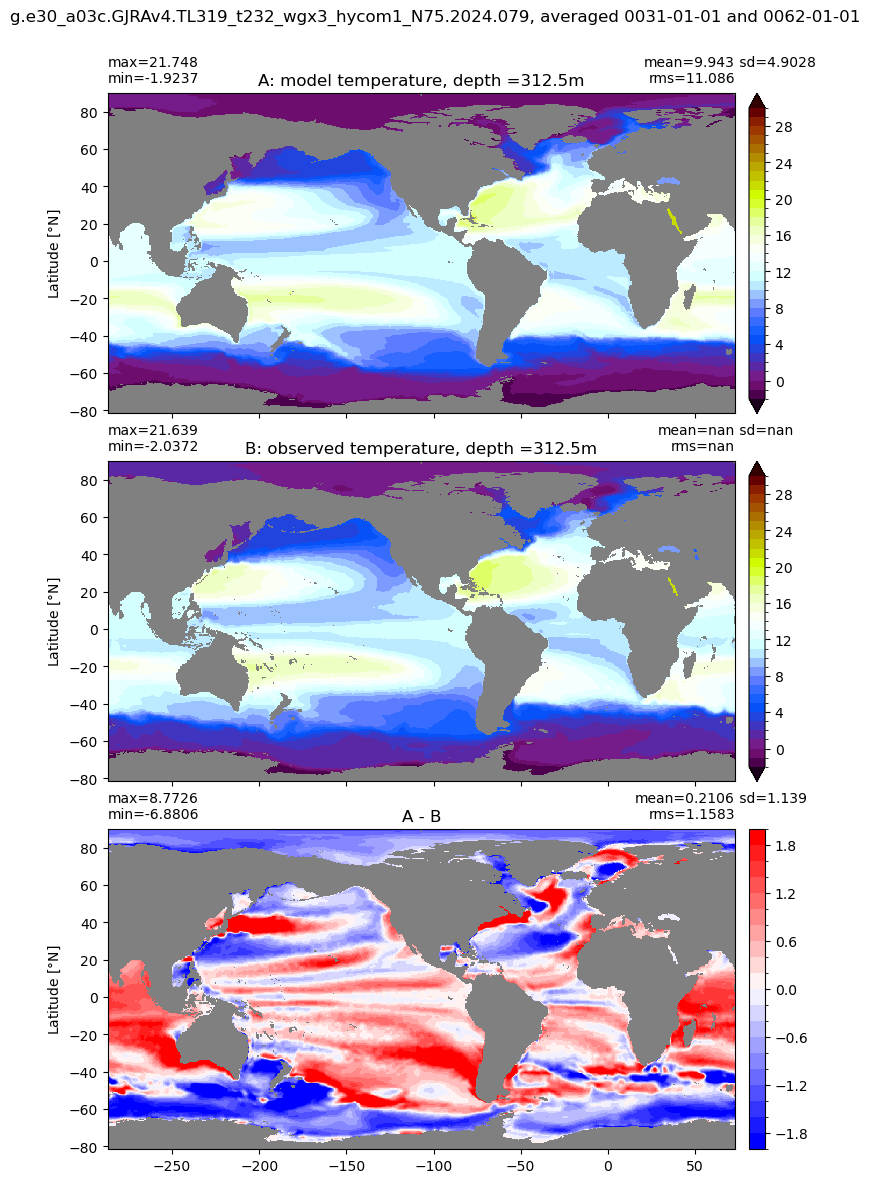
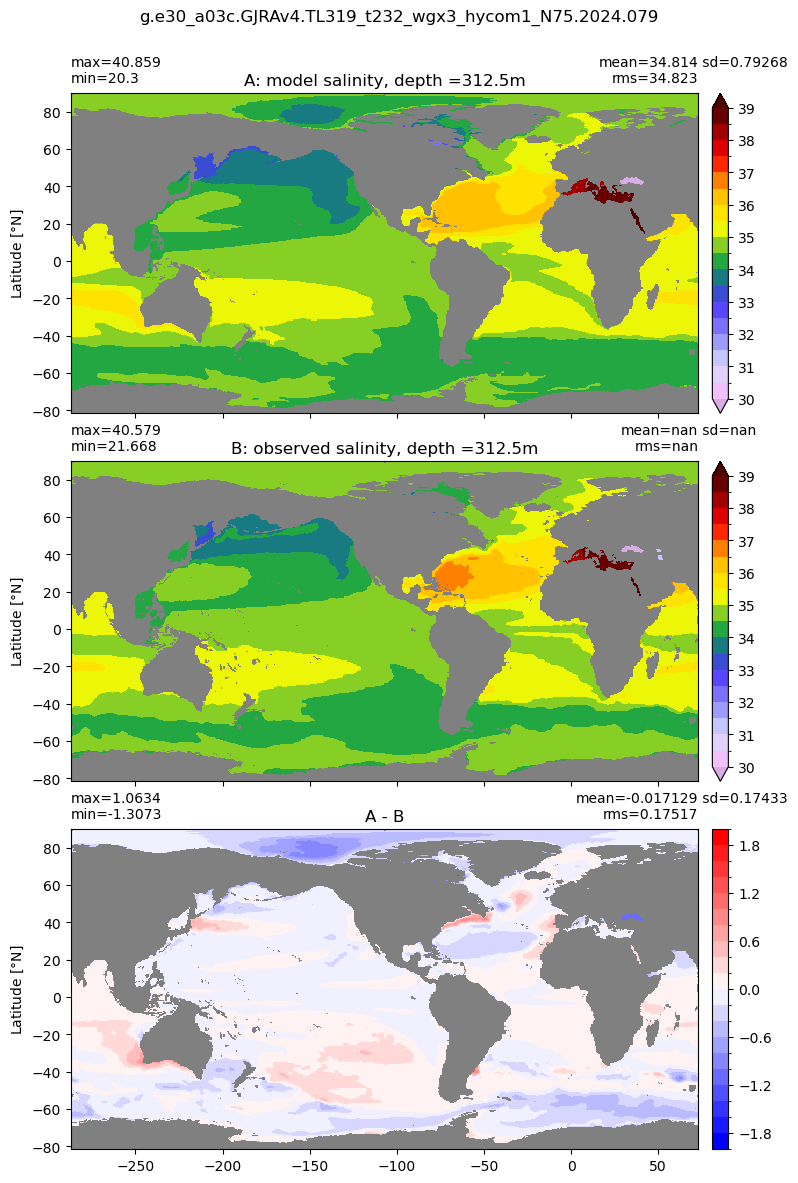
Temprature and salinity comparisons (model vs obs) at selected depth levels are grouped into the following regions: Global, Antarctic, and Arctic.
[1]:
%load_ext autoreload
%autoreload 2
[2]:
%matplotlib inline

import warnings
warnings.filterwarnings("ignore")
from mom6_tools.MOM6grid import MOM6grid
from mom6_tools.m6plot import xycompare, polarcomparison
from mom6_tools.m6toolbox import cime_xmlquery, weighted_temporal_mean_vars
from mom6_tools import m6toolbox
from ncar_jobqueue import NCARCluster
from dask.distributed import Client
import yaml, intake, os
import matplotlib.pyplot as plt
import numpy as np
import xarray as xr
from IPython.display import display, Markdown, Latex
ERROR 1: PROJ: proj_create_from_database: Open of /glade/work/gmarques/conda-envs/mom6-tools/share/proj failed
Basemap module not found. Some regional plots may not function properly
[3]:
# Read in the yaml file
diag_config_yml_path = "diag_config.yml"
diag_config_yml = yaml.load(open(diag_config_yml_path,'r'), Loader=yaml.Loader)
[4]:
caseroot = diag_config_yml['Case']['CASEROOT']
casename = cime_xmlquery(caseroot, 'CASE')
DOUT_S = cime_xmlquery(caseroot, 'DOUT_S')
if DOUT_S:
  OUTDIR = cime_xmlquery(caseroot, 'DOUT_S_ROOT')+'/ocn/hist/'
else:
  OUTDIR = cime_xmlquery(caseroot, 'RUNDIR')

print('Output directory is:', OUTDIR)
print('Casename is:', casename)
Output directory is: /glade/derecho/scratch/gmarques/archive/g.e30_a03c.GJRAv4.TL319_t232_wgx3_hycom1_N75.2024.079/ocn/hist/
Casename is: g.e30_a03c.GJRAv4.TL319_t232_wgx3_hycom1_N75.2024.079
[5]:
# The following parameters must be set accordingly
######################################################

# create an empty class object
class args:
  pass

# load avg dates
avg = diag_config_yml['Avg']

args.start_date = avg['start_date']
args.end_date = avg['end_date']
args.casename = casename
args.obs = "woa-2018-tx2_3v2-annual-all"
args.monthly = casename+diag_config_yml['Fnames']['z']
args.static = casename+diag_config_yml['Fnames']['static']
args.geom =   casename+diag_config_yml['Fnames']['geom']
args.savefigs = False
args.nw = 6 # requesting 6 workers
[22]:
# load mom6 grid
# read grid info
geom_file = OUTDIR+'/'+args.geom
if os.path.exists(geom_file):
  grd_xr = MOM6grid(OUTDIR+'/'+args.static, geom_file, xrformat=True)
  grd = MOM6grid(OUTDIR+'/'+args.static, geom_file)
else:
  grd_xr = MOM6grid(OUTDIR+'/'+args.static, xrformat=True)
  grd = MOM6grid(OUTDIR+'/'+args.static)

try:
  area = grd_xr.area_t.where(grd_xr.wet > 0).values
except:
  area = grd_xr.areacello.where(grd_xr.wet > 0).values
MOM6 grid successfully loaded...

MOM6 grid successfully loaded...
[7]:
parallel = False
if args.nw > 1:
  parallel = True
  cluster = NCARCluster()
  cluster.scale(args.nw)
  client = Client(cluster)
  client
[8]:
client
[8]:
Client
Client-56976830-9e36-11ef-ae1d-3cecef1b11de
| Connection method: Cluster object | Cluster type: dask_jobqueue.PBSCluster |
| Dashboard: https://jupyterhub.hpc.ucar.edu/stable/user/gmarques/High-mem/proxy/8787/status |
Cluster Info
PBSCluster
c08fb1f4
| Dashboard: https://jupyterhub.hpc.ucar.edu/stable/user/gmarques/High-mem/proxy/8787/status | Workers: 0 |
| Total threads: 0 | Total memory: 0 B |
Scheduler Info
Scheduler
Scheduler-b432bac2-44aa-4d46-a7ee-eac6a5026a84
| Comm: tcp://128.117.208.100:36763 | Workers: 0 |
| Dashboard: https://jupyterhub.hpc.ucar.edu/stable/user/gmarques/High-mem/proxy/8787/status | Total threads: 0 |
| Started: Just now | Total memory: 0 B |
Workers
[9]:
# load history files

def preprocess(ds):
    ''' Return a dataset desired variables'''
    variables = ['thetao', 'so']
    return ds[variables]

ds = xr.open_mfdataset(OUTDIR+args.monthly, \
         parallel=True, data_vars='minimal', \
         coords='minimal', compat='override', preprocess=preprocess)
[10]:
# Select data
%time ds_sel = ds.sel(time=slice(args.start_date, args.end_date))
CPU times: user 10.4 ms, sys: 0 ns, total: 10.4 ms
Wall time: 10.7 ms
[11]:
# compute annual mean and then average in time
ds_ann = weighted_temporal_mean_vars(ds_sel)
[12]:
thetao_mean = ds_ann.thetao.mean('time')
temp = np.ma.masked_invalid(thetao_mean.values)
[13]:
so_mean = ds_ann.so.mean('time')
salt = np.ma.masked_invalid(so_mean.values)
[14]:
# load WOA18 data
catalog = intake.open_catalog(diag_config_yml['oce_cat'])
woa18 = catalog[args.obs].to_dask()
woa18 = woa18.rename({'z_l' : 'depth'});
[15]:
print('Saving netCDF files...')

if not os.path.isdir('ncfiles'):
      os.system('mkdir -p ncfiles')

attrs = {'description': 'model - obs at depth levels',
       'start_date': args.start_date,
       'end_date': args.end_date,
       'casename': casename,
       'obs': args.obs,
       }
Saving netCDF files...
[16]:
temp_bias = np.ma.masked_invalid(thetao_mean.values - woa18.thetao.values)
ds_thetao = xr.Dataset(data_vars={ 'thetao' : (('z_l','yh','xh'), thetao_mean.values),
                                   'thetao_bias' :     (('z_l','yh','xh'), temp_bias)},
                                   coords={'z_l' : ds.z_l, 'yh' : grd.yh, 'xh' : grd.xh})
m6toolbox.add_global_attrs(ds_thetao,attrs)
ds_thetao.to_netcdf('ncfiles/'+str(casename)+'_thetao_time_mean.nc')
[17]:
so_bias = np.ma.masked_invalid(so_mean.values - woa18.so.values)
ds_so = xr.Dataset(data_vars={ 'so' : (('z_l','yh','xh'), so_mean.values),
                            'so_bias' :     (('z_l','yh','xh'), so_bias)},
                            coords={'z_l' : ds.z_l, 'yh' : grd.yh, 'xh' : grd.xh})
m6toolbox.add_global_attrs(ds_so,attrs)
ds_so.to_netcdf('ncfiles/'+str(casename)+'_so_time_mean.nc')
[18]:
client.close(); cluster.close()
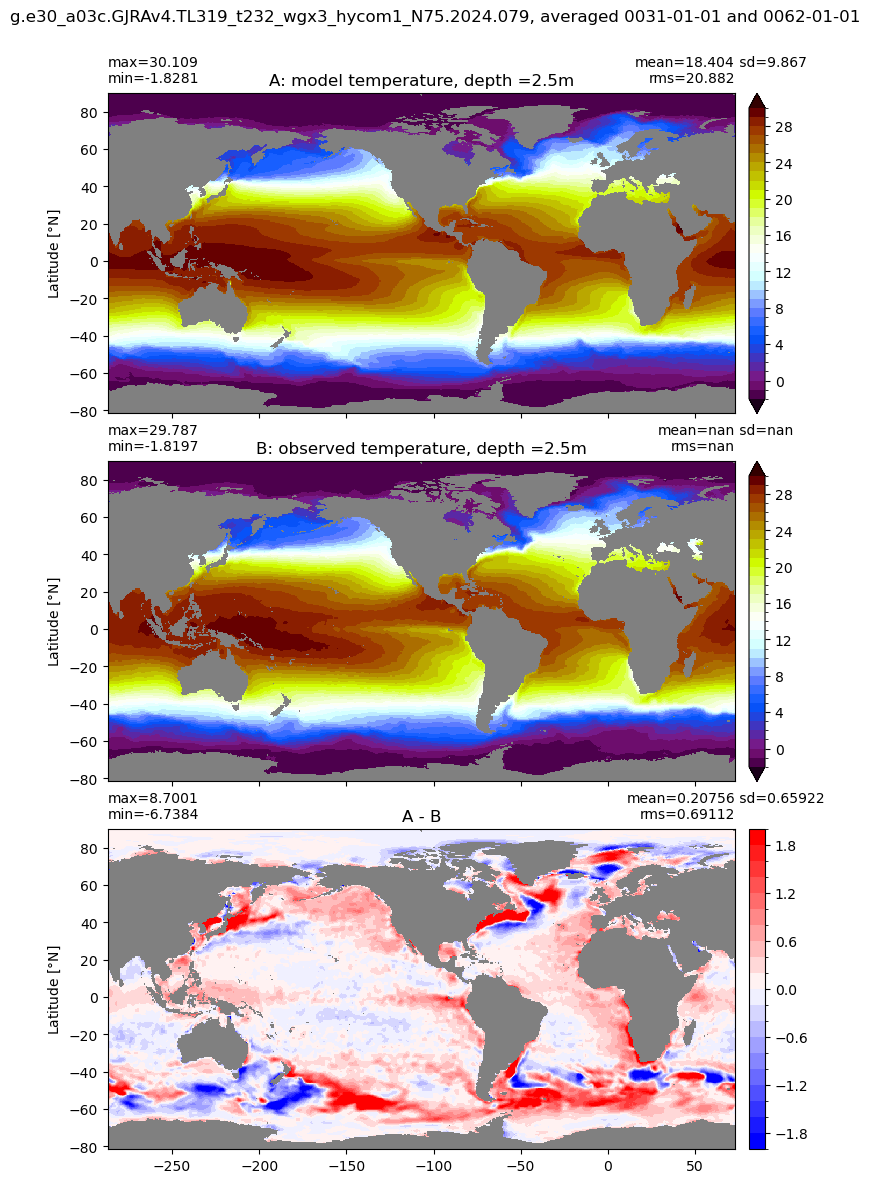
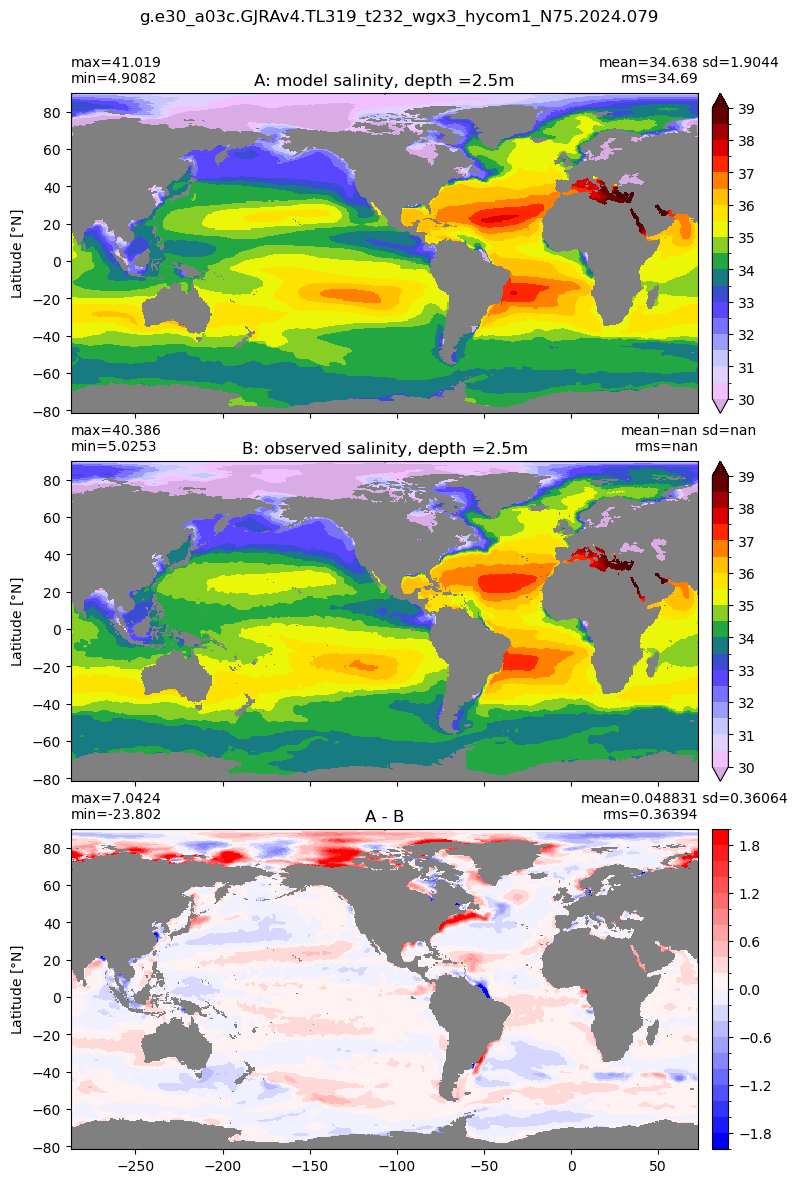
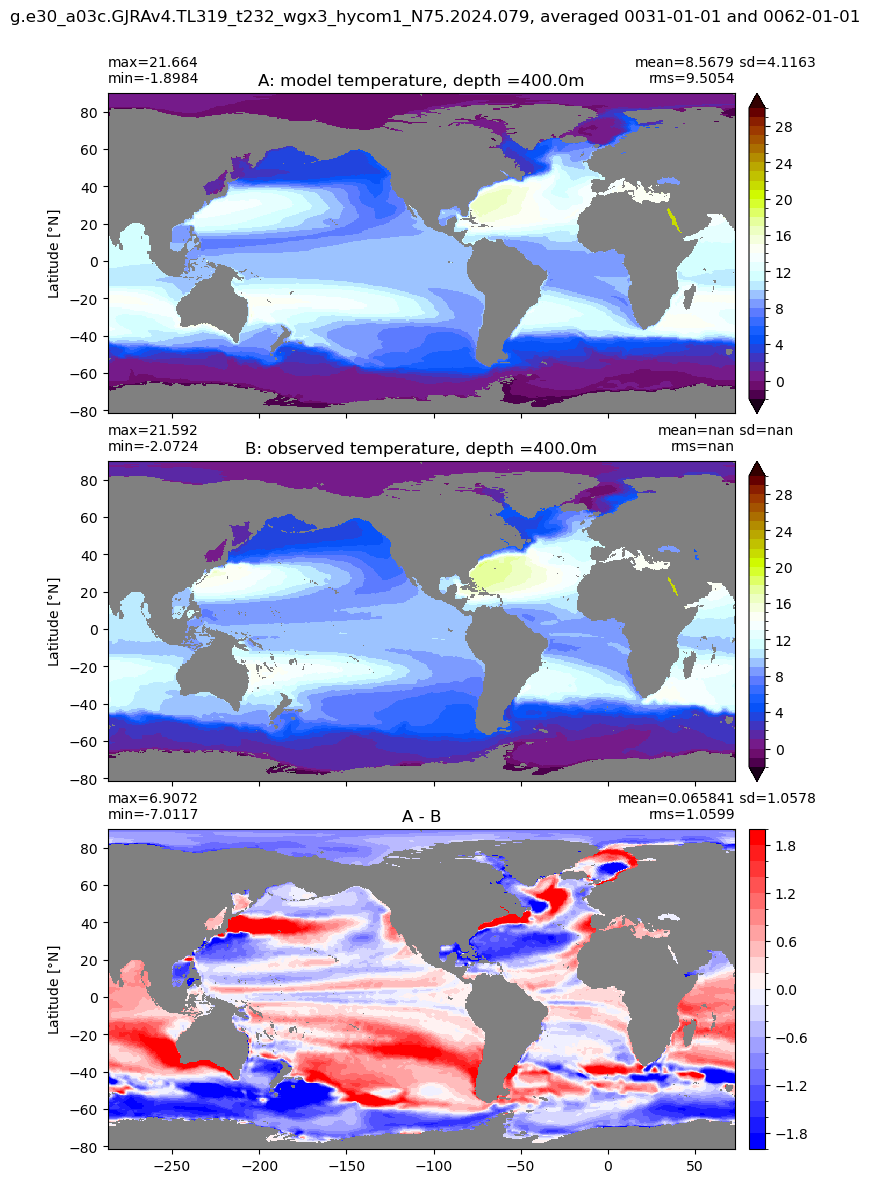
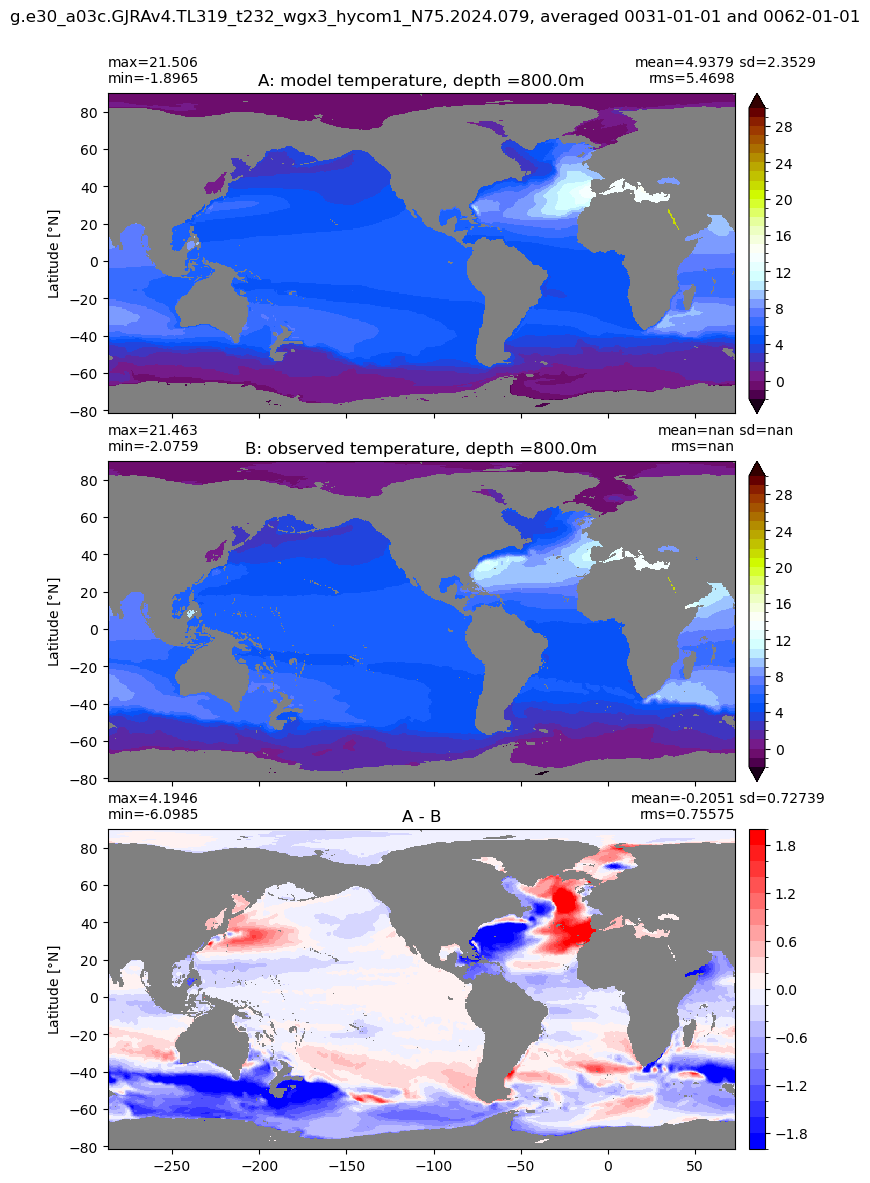
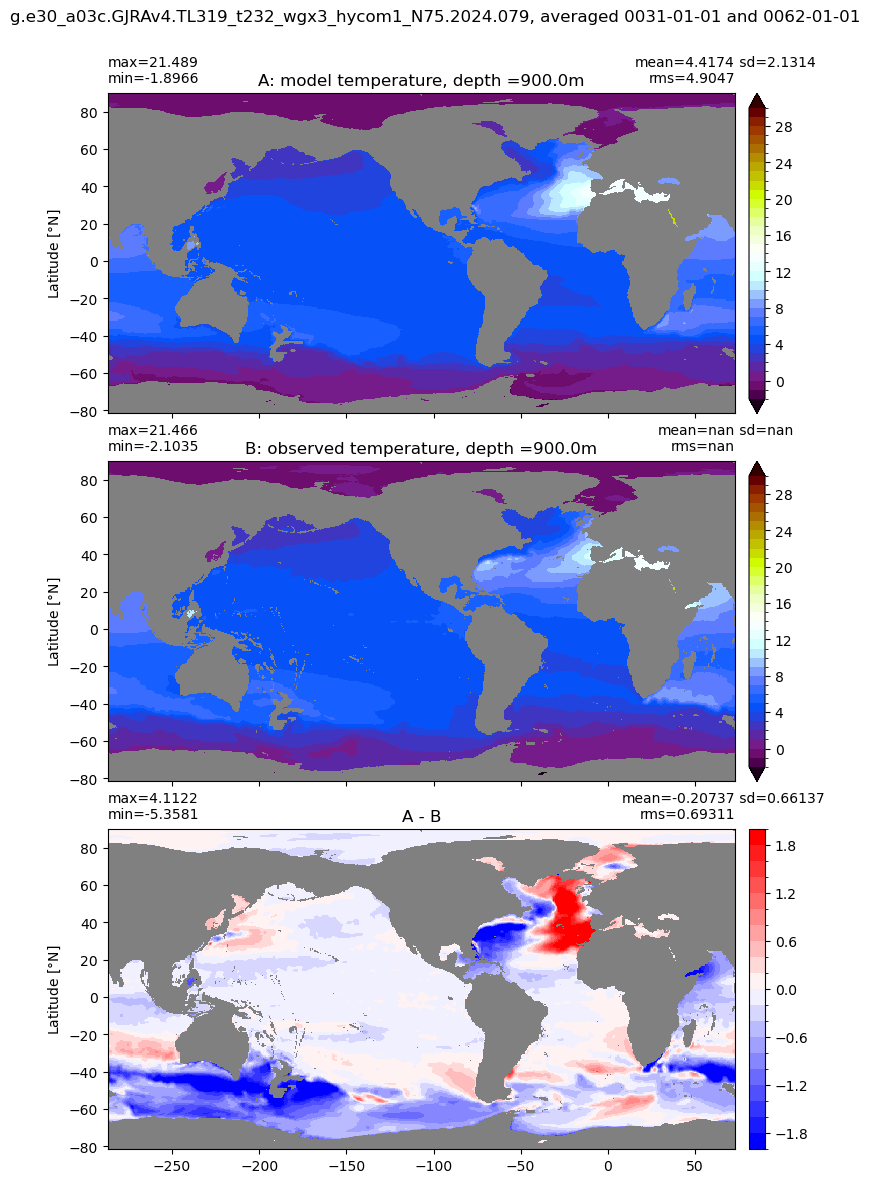
Global
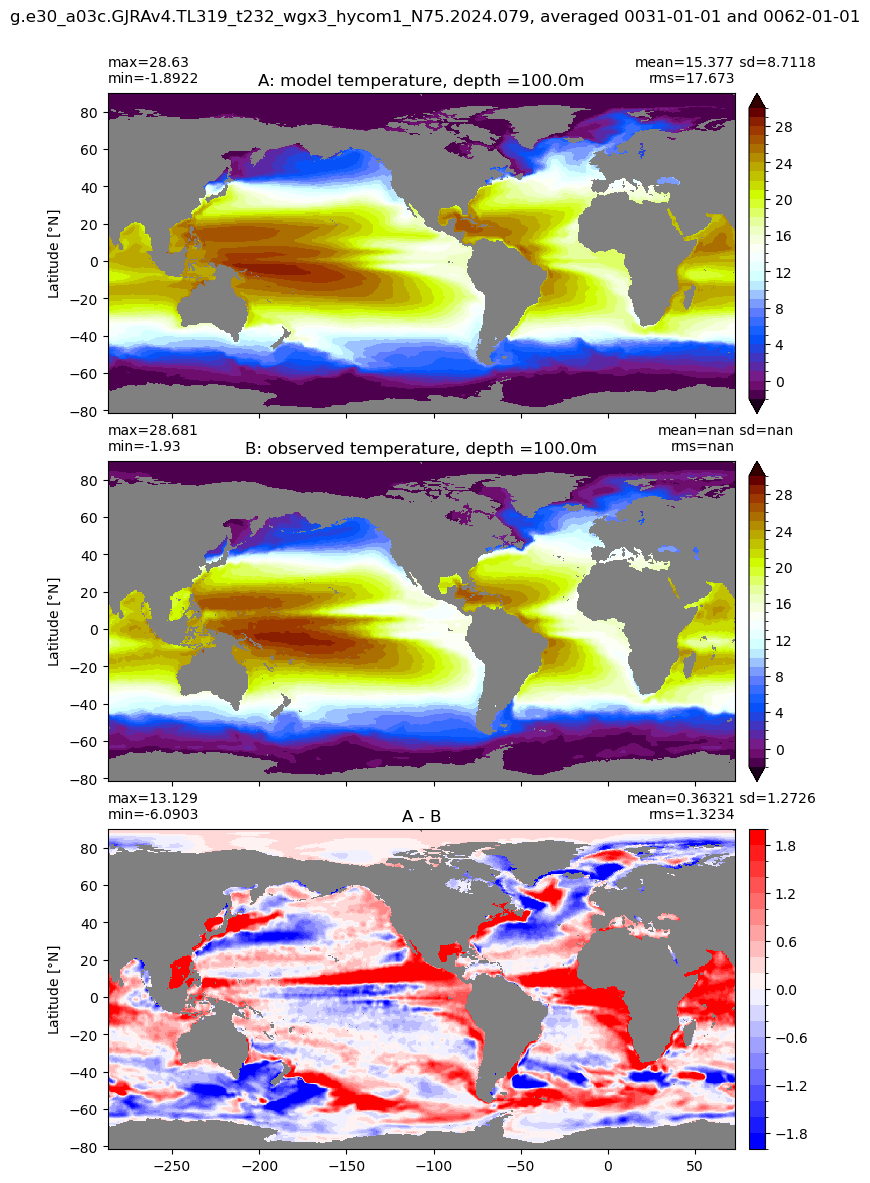
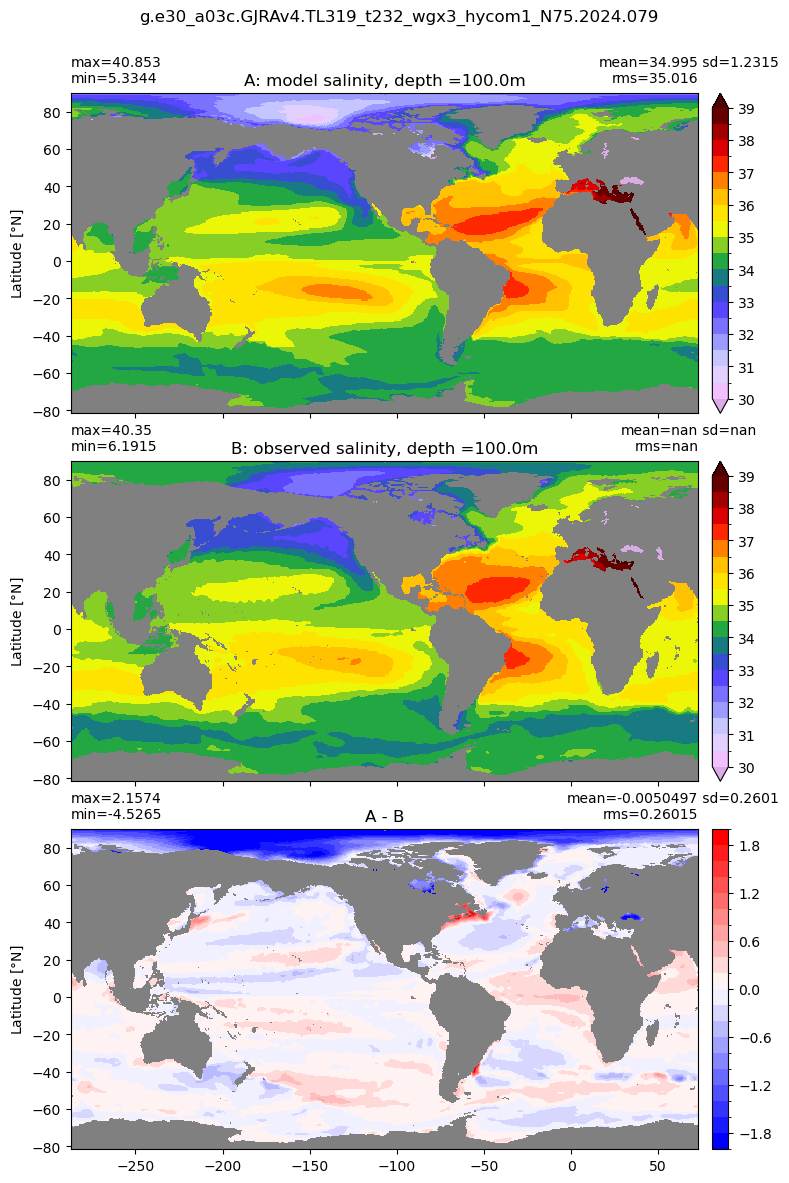
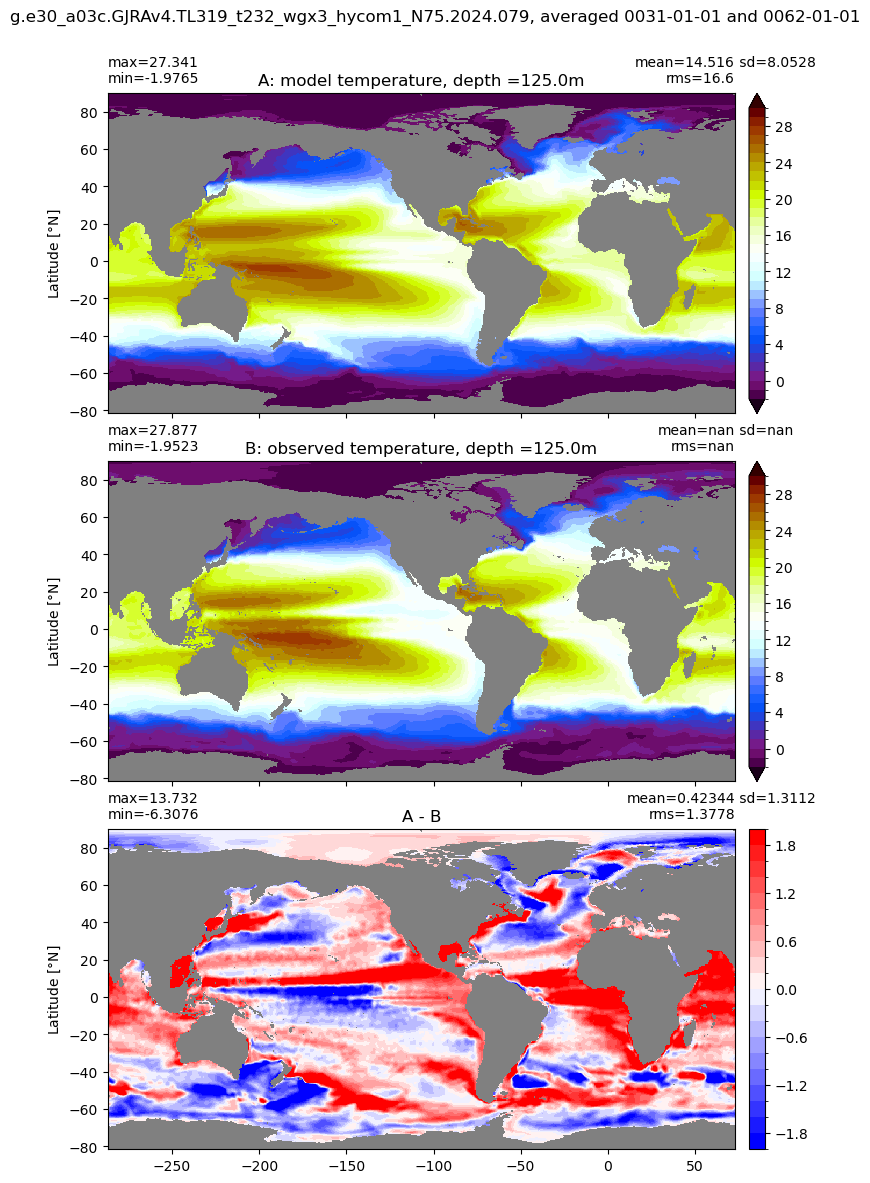
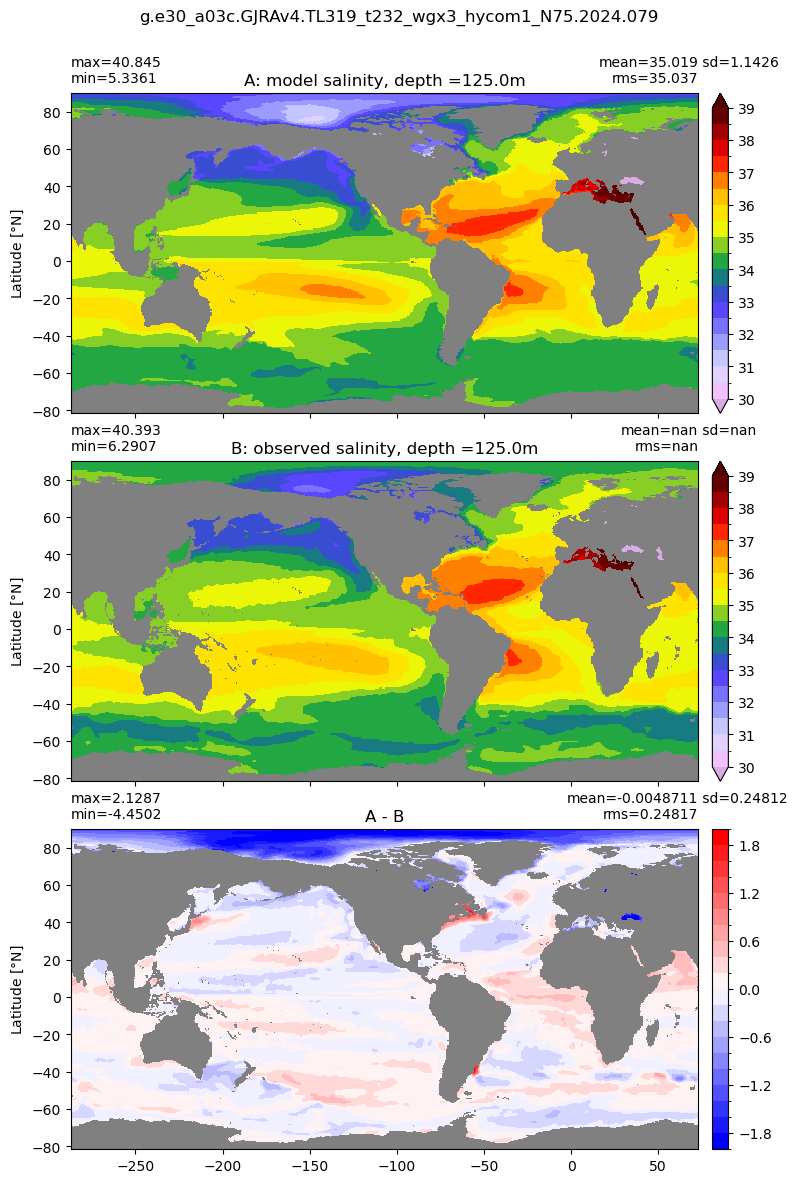
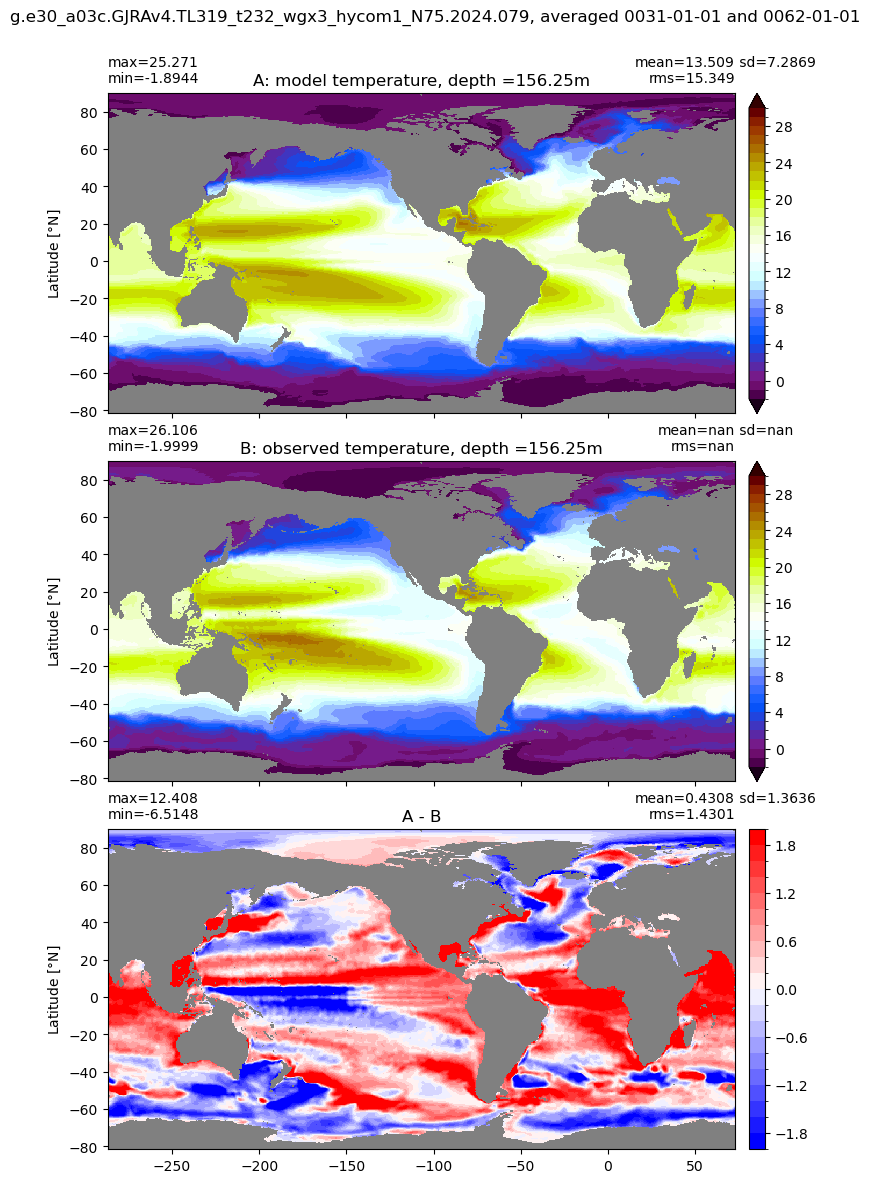
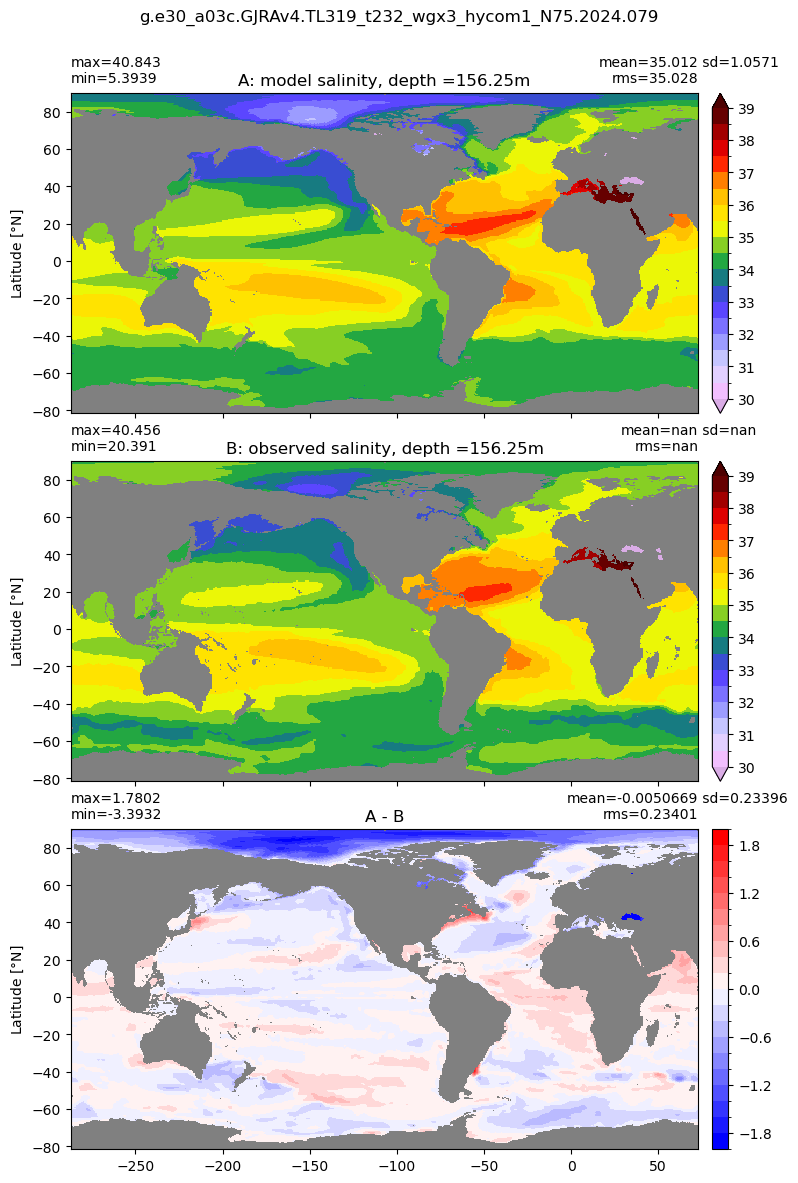
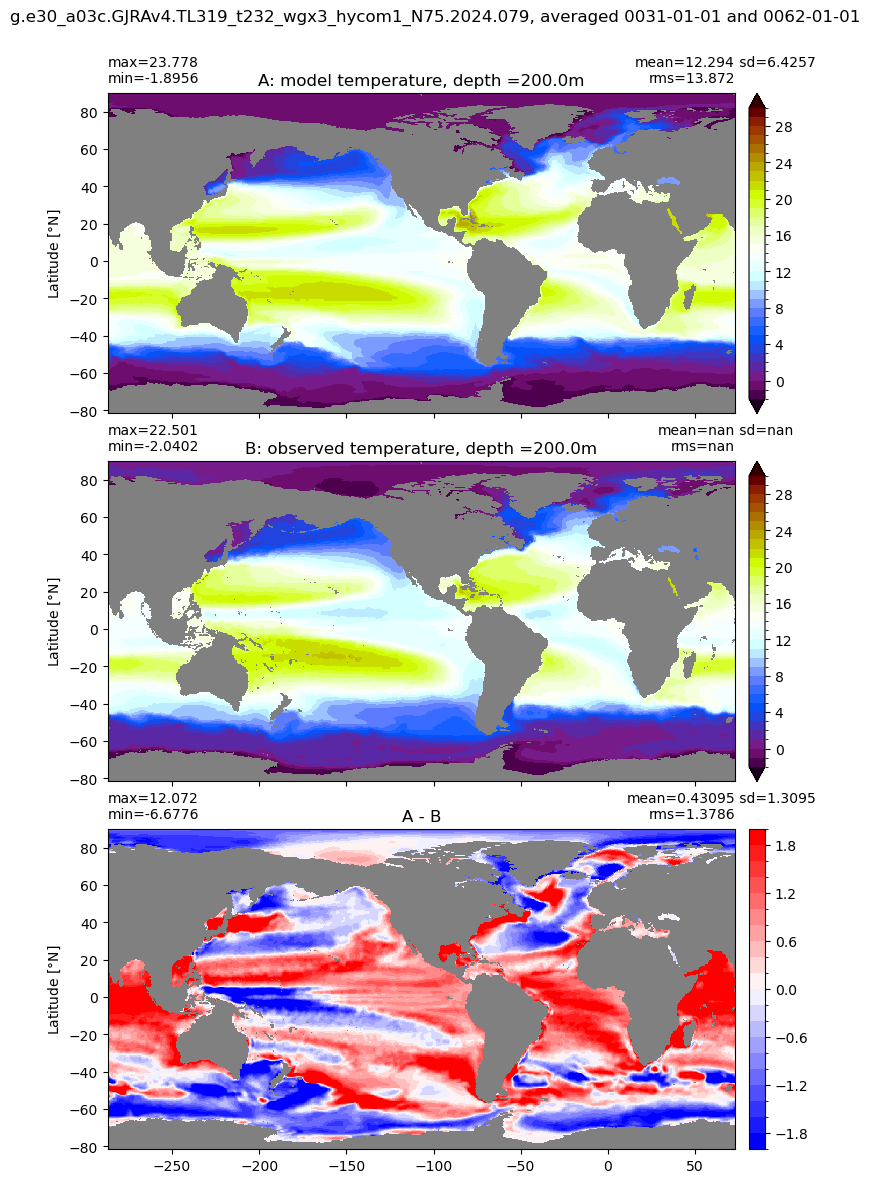
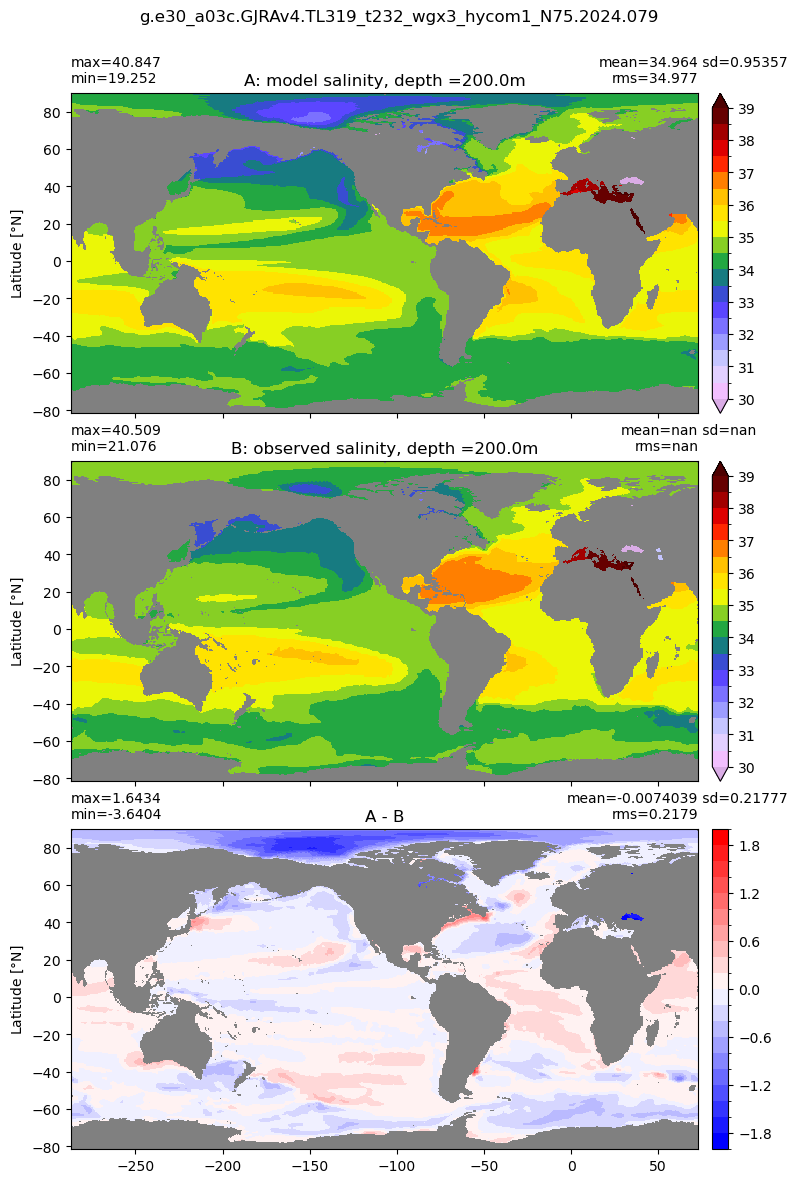
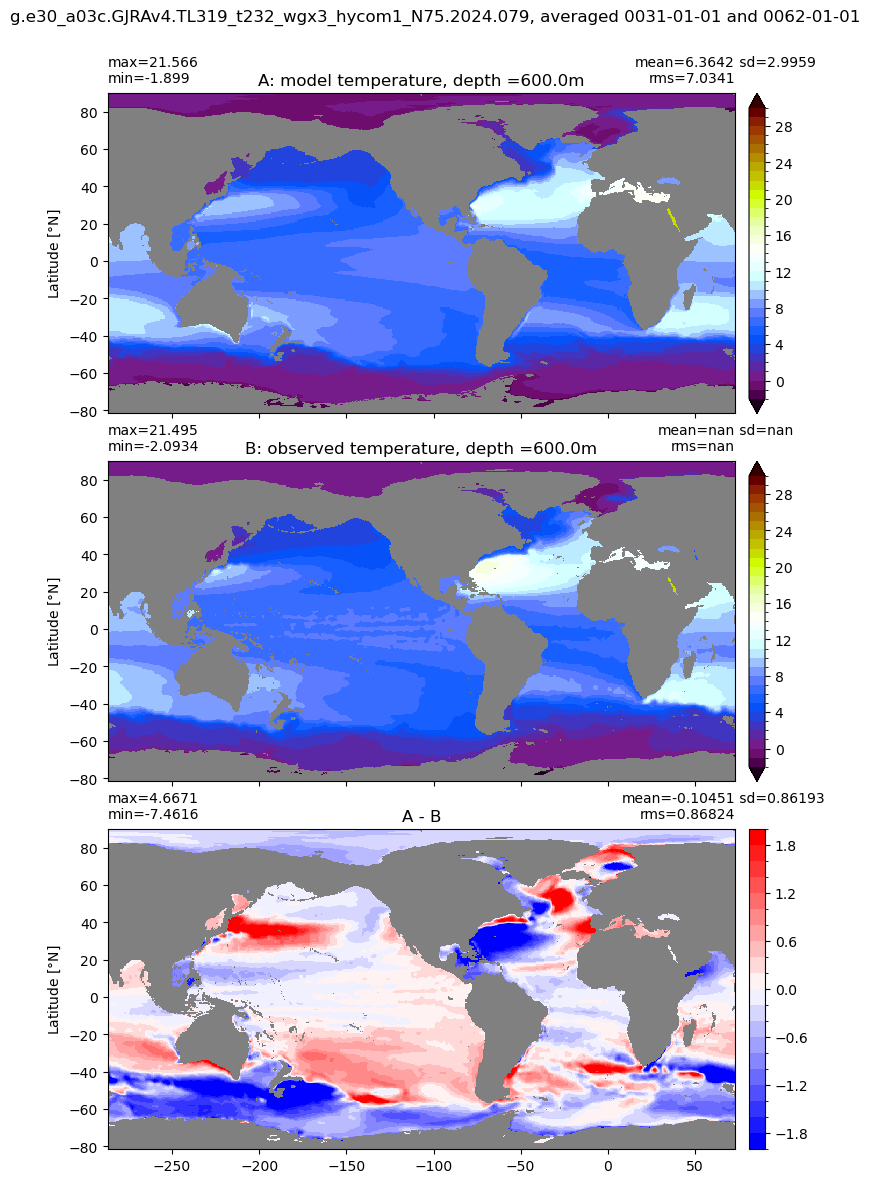
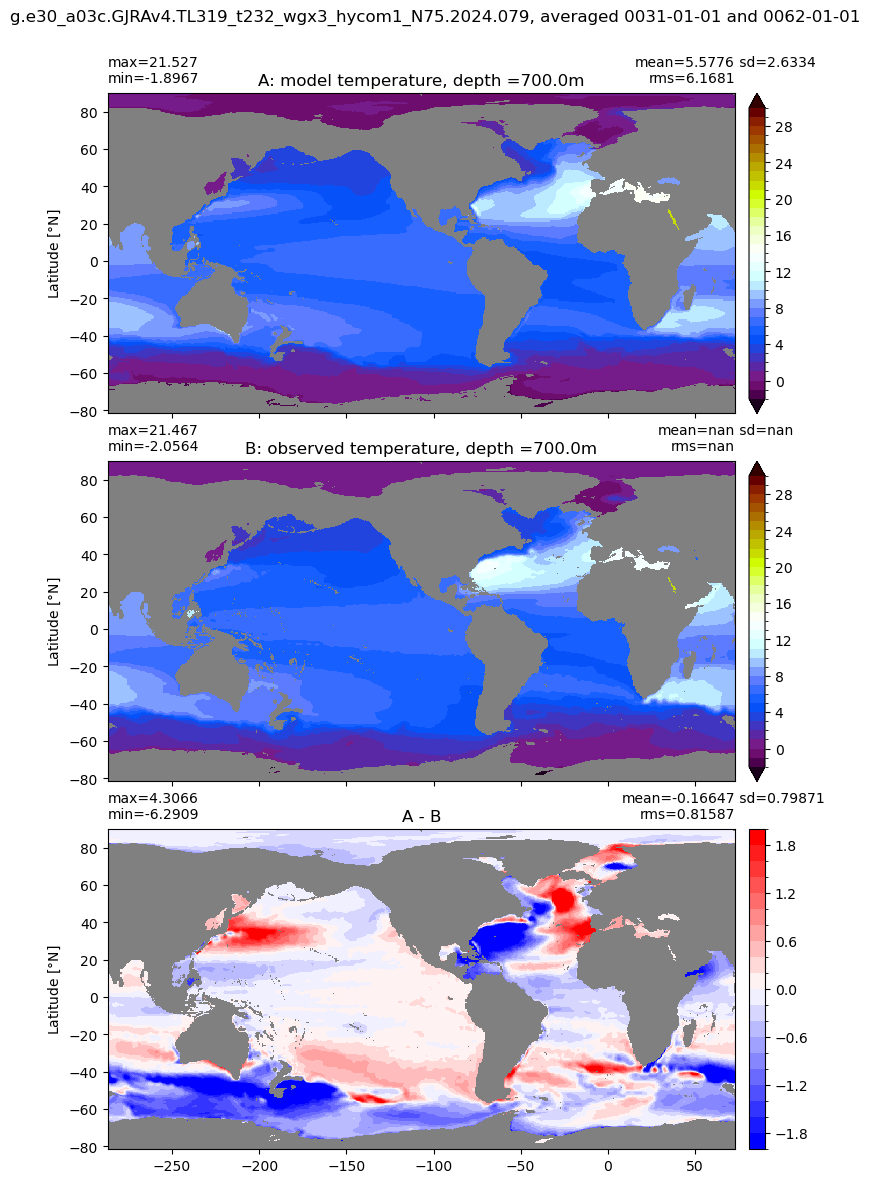
[19]:
%matplotlib inline
km = len(woa18['depth'])
for k in range(km):
if ds['z_l'][k].values < 1000.0:
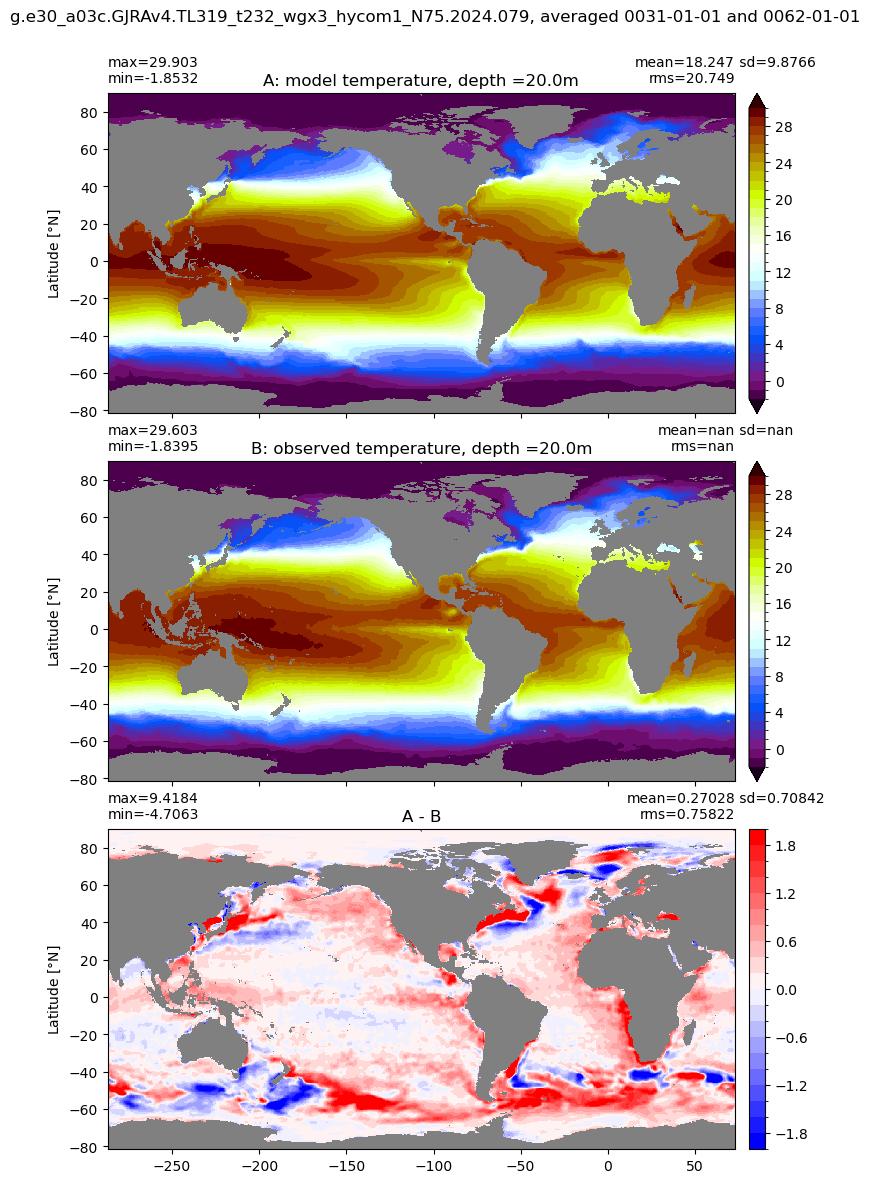
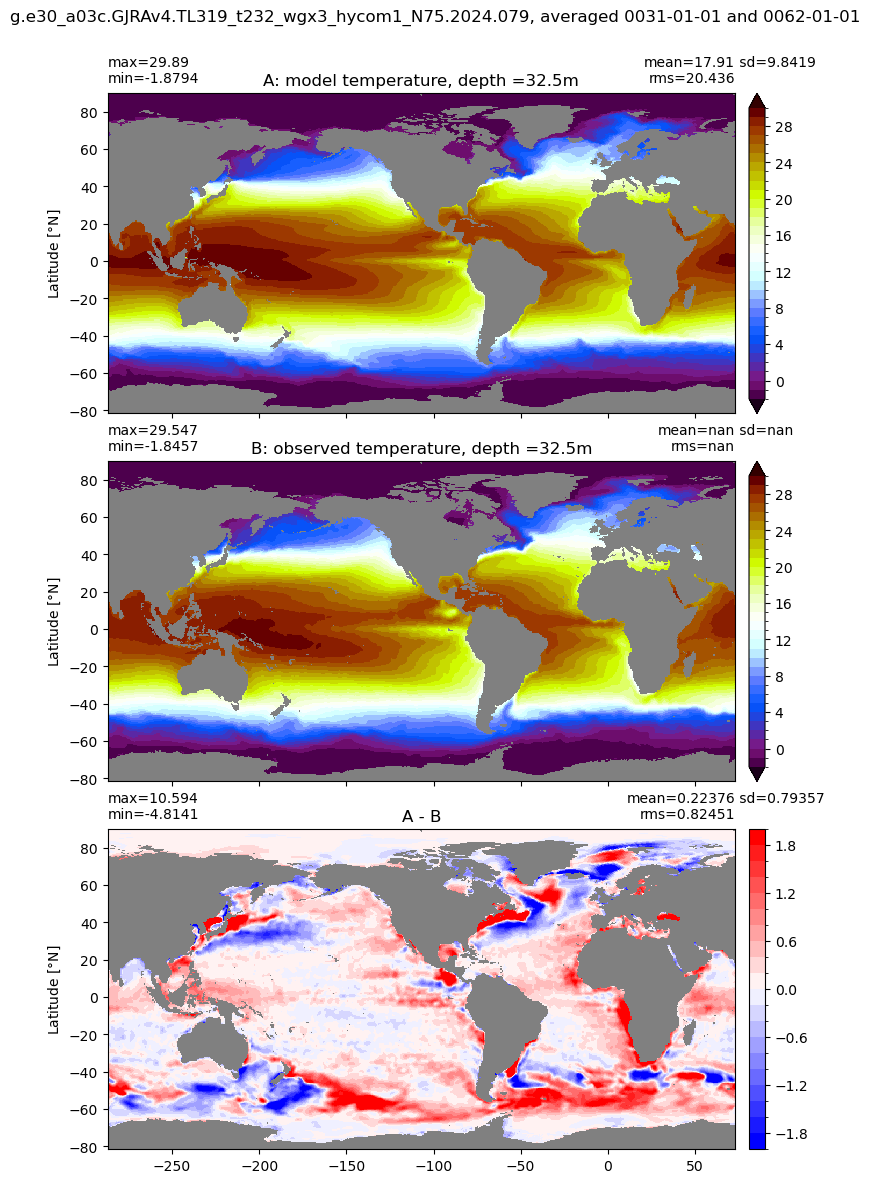
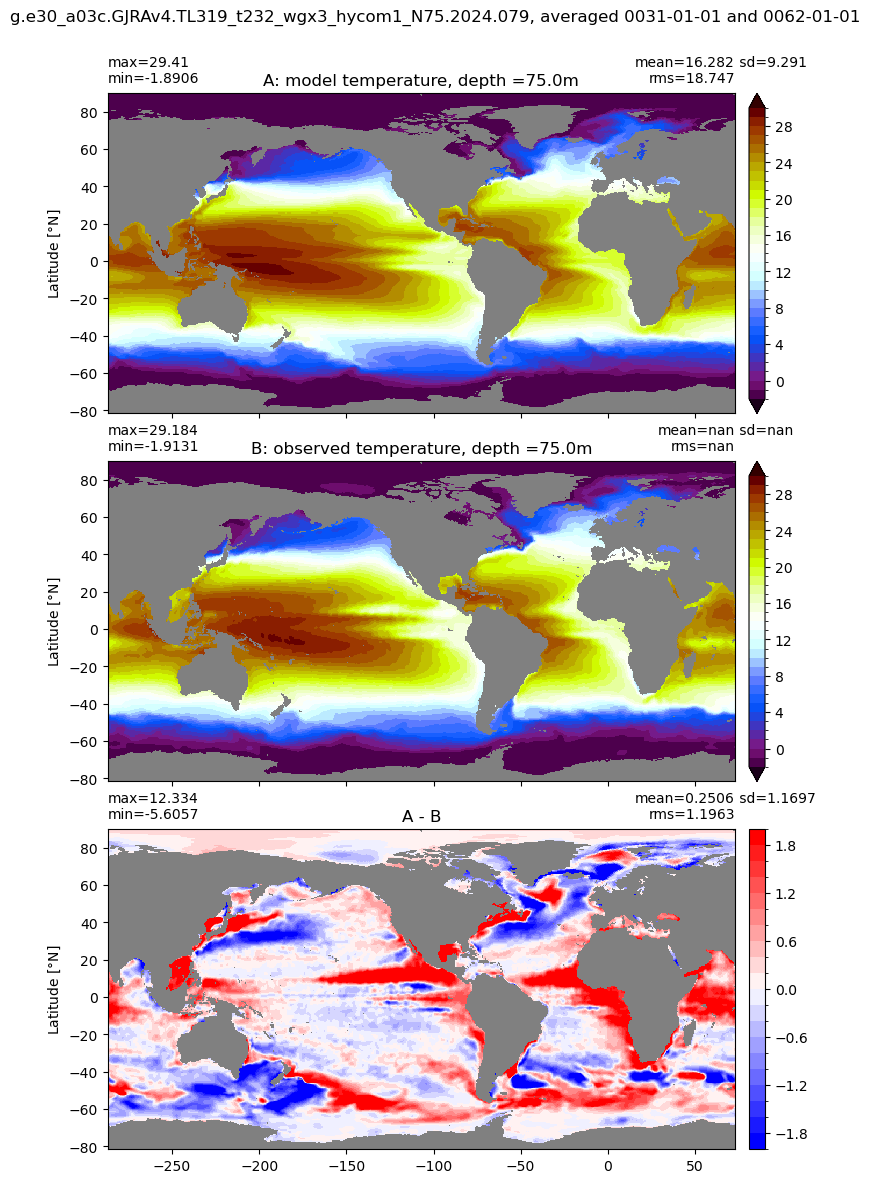
temp_obs = np.ma.masked_invalid(woa18['thetao'][k,:].values)
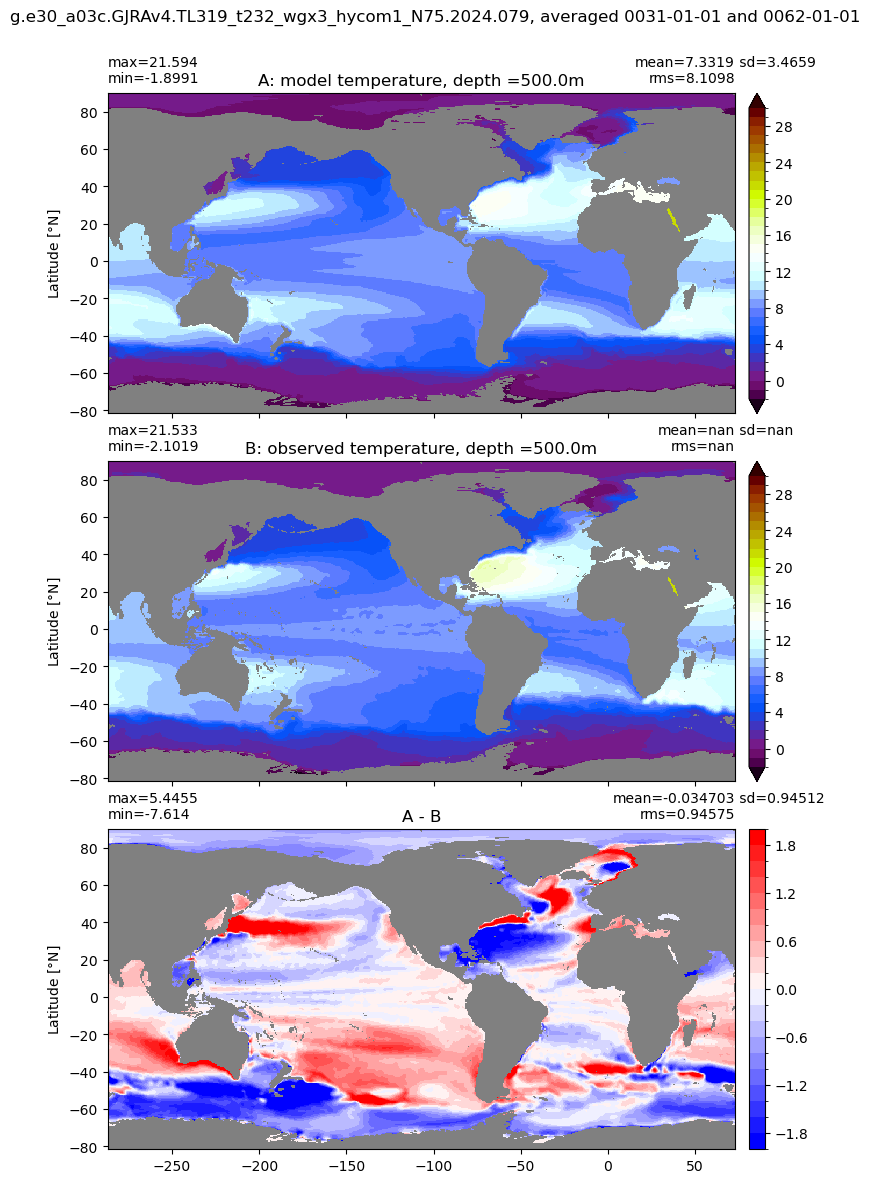
xycompare(temp[k,:] , temp_obs, grd.geolon, grd.geolat, area=area,
title1 = 'model temperature, depth ='+str(ds['z_l'][k].values)+ 'm',
title2 = 'observed temperature, depth ='+str(woa18['depth'][k].values)+ 'm',
suptitle=casename + ', averaged '+str(args.start_date)+ ' and ' +str(args.end_date),
clim=(-1.9,30.), dcolormap=plt.cm.bwr,
extend='both', dextend='neither', dlim=(-2,2),
show= True)
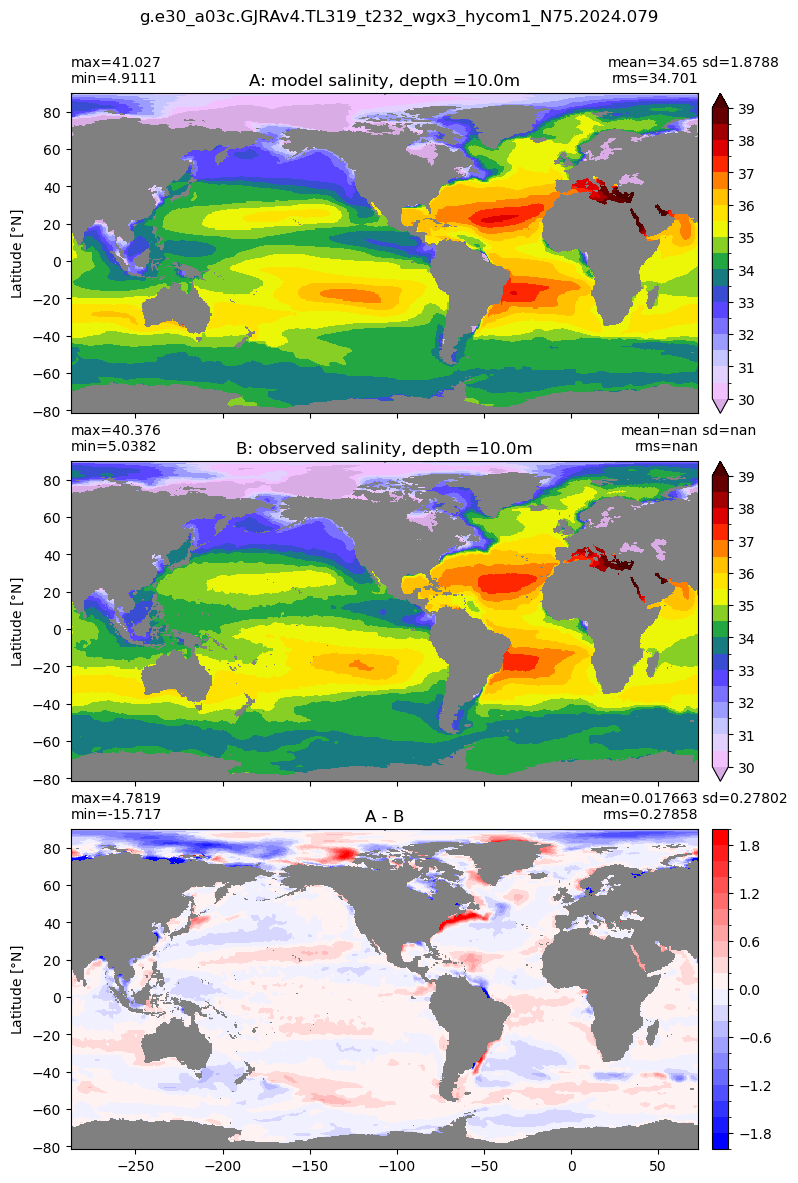
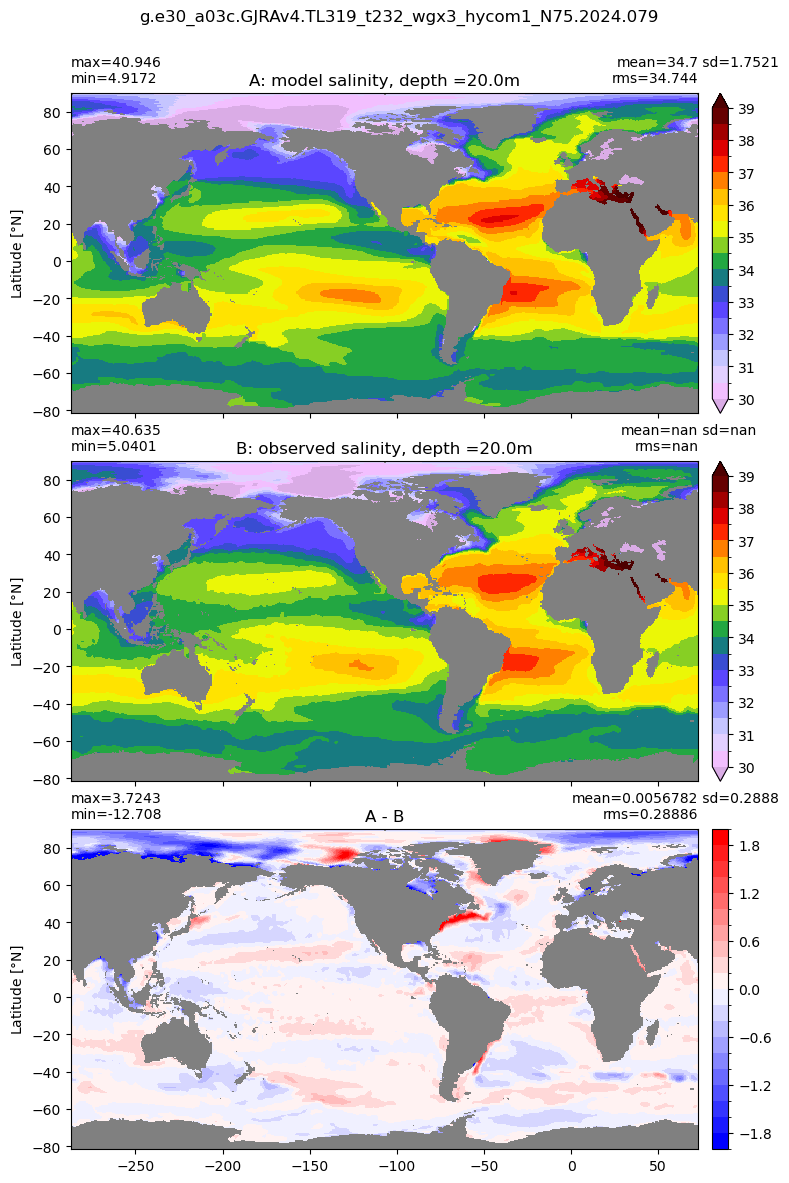
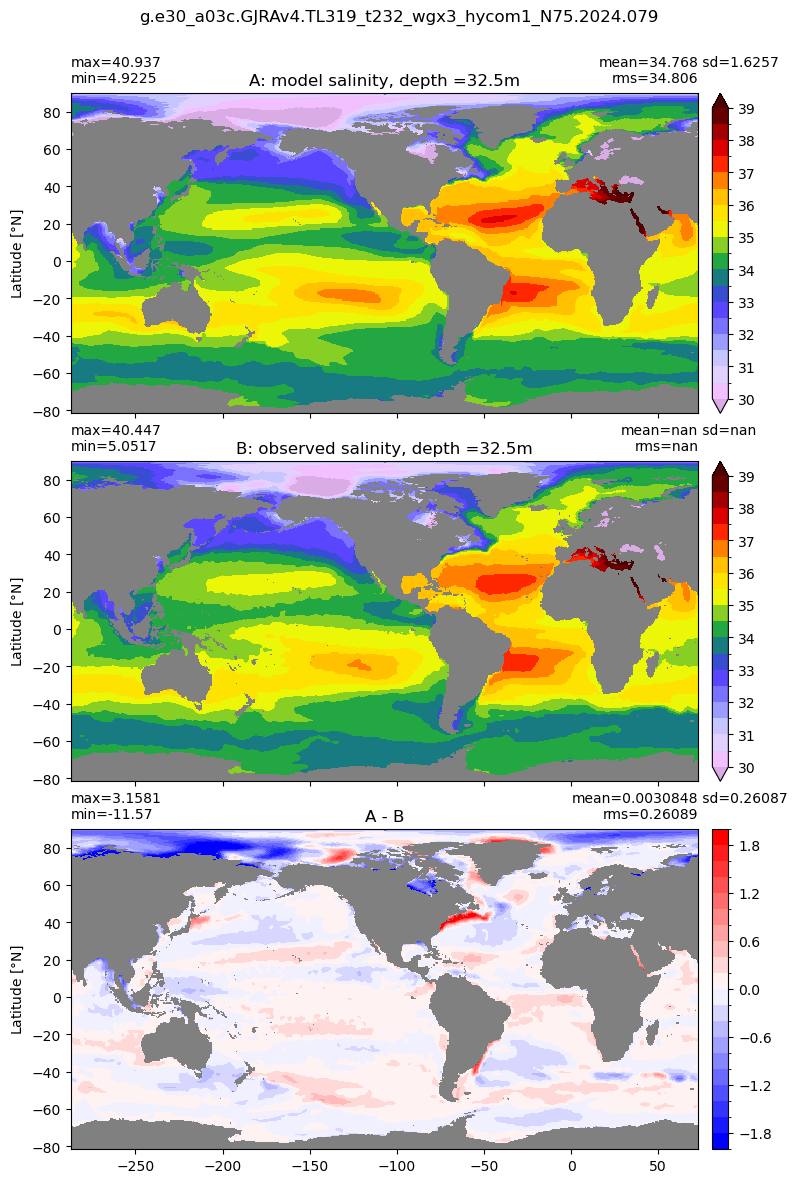
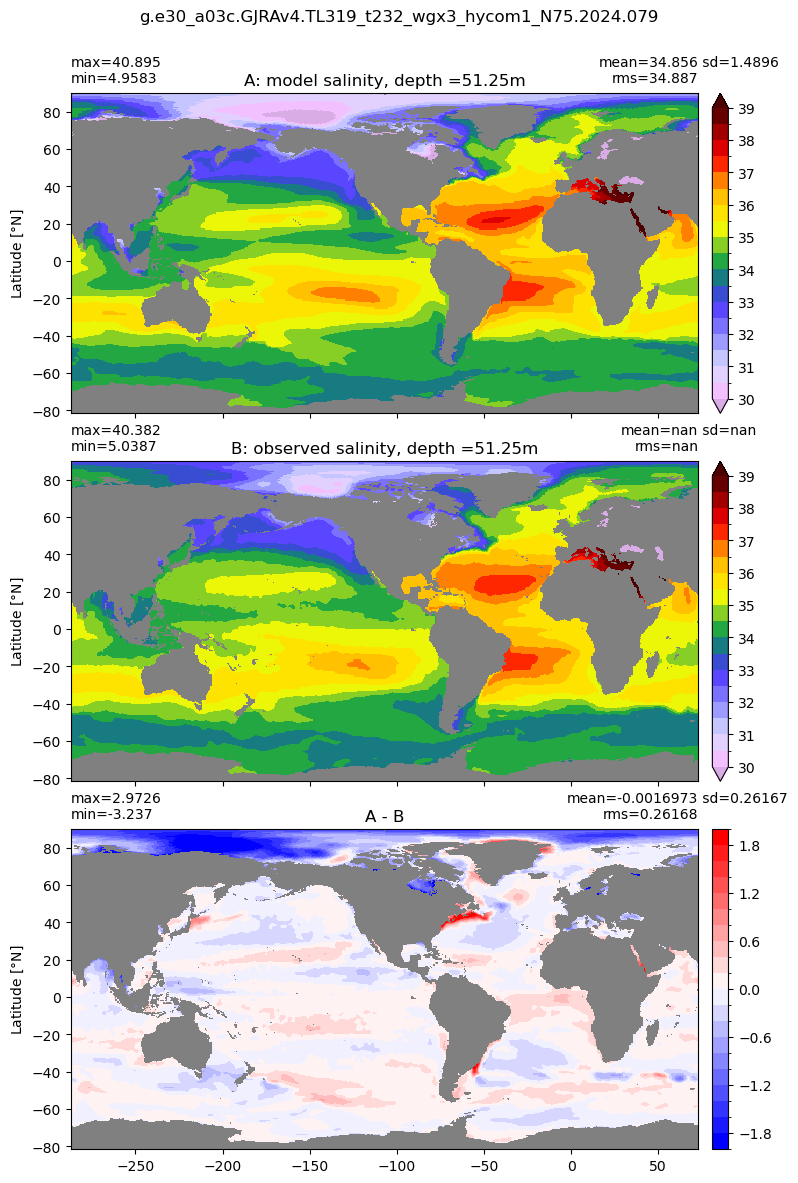
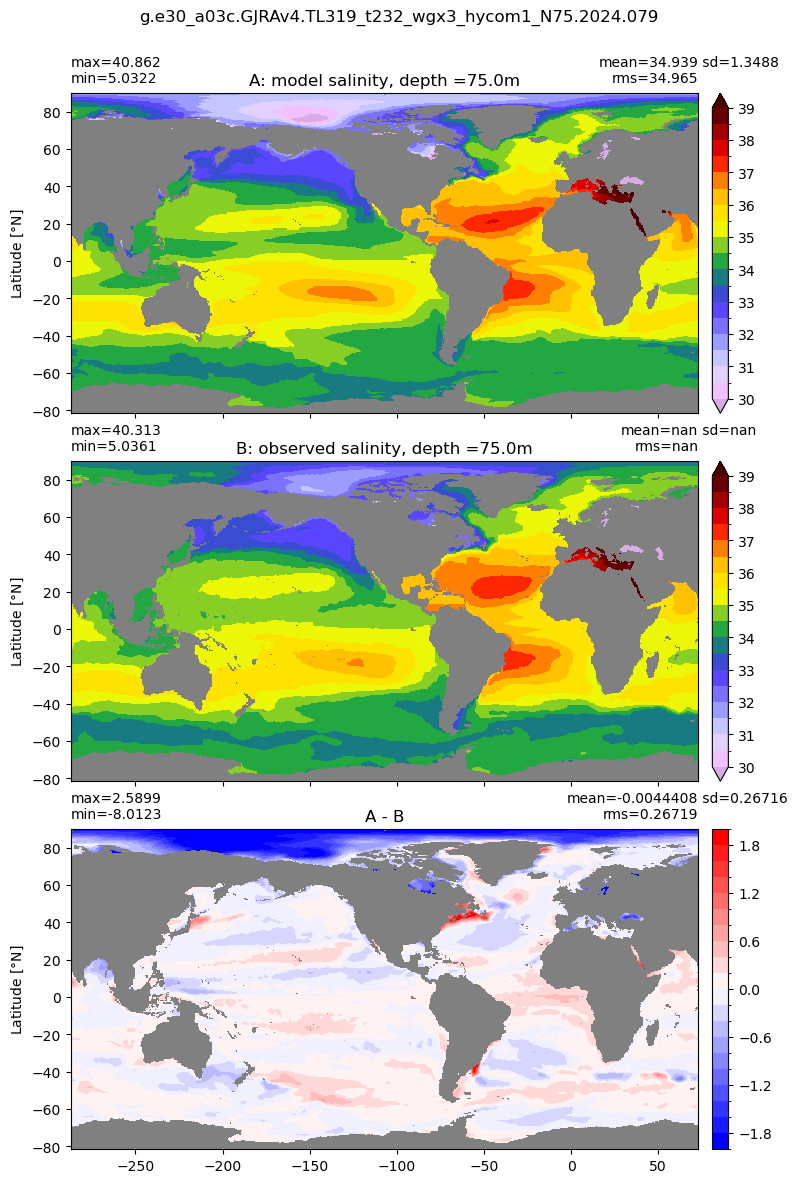
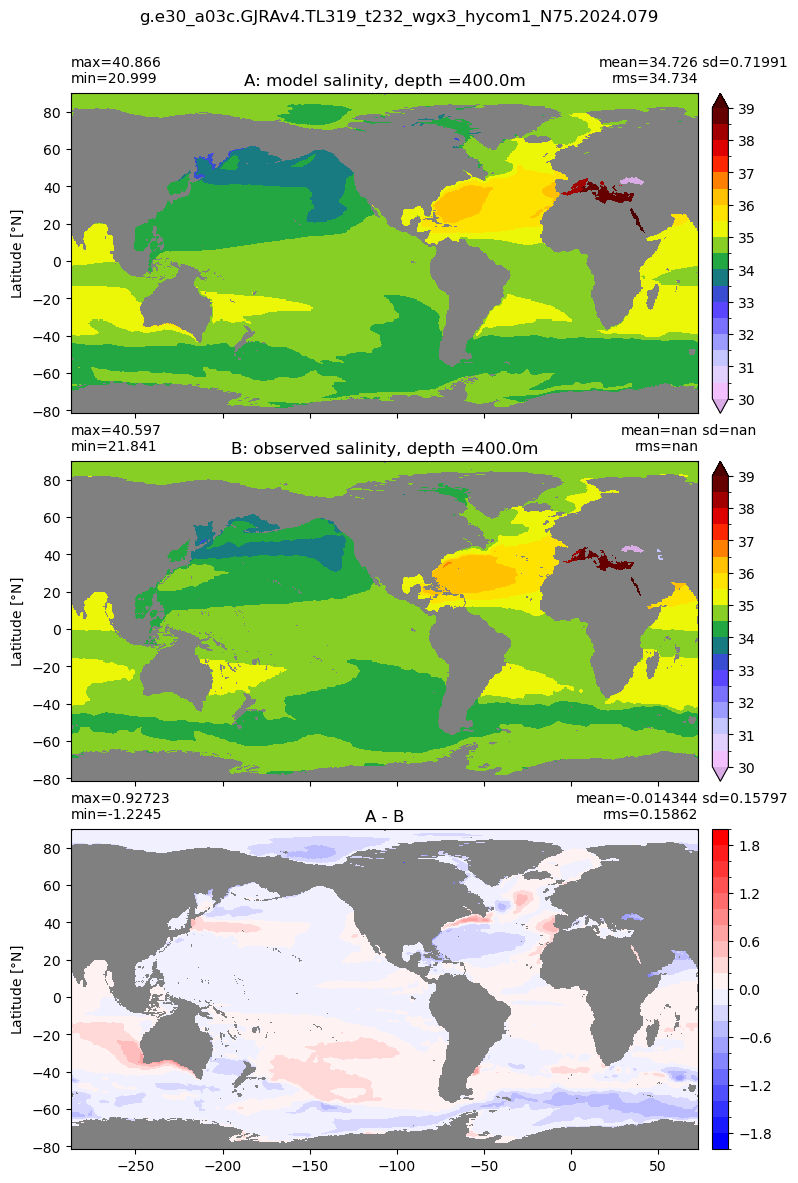
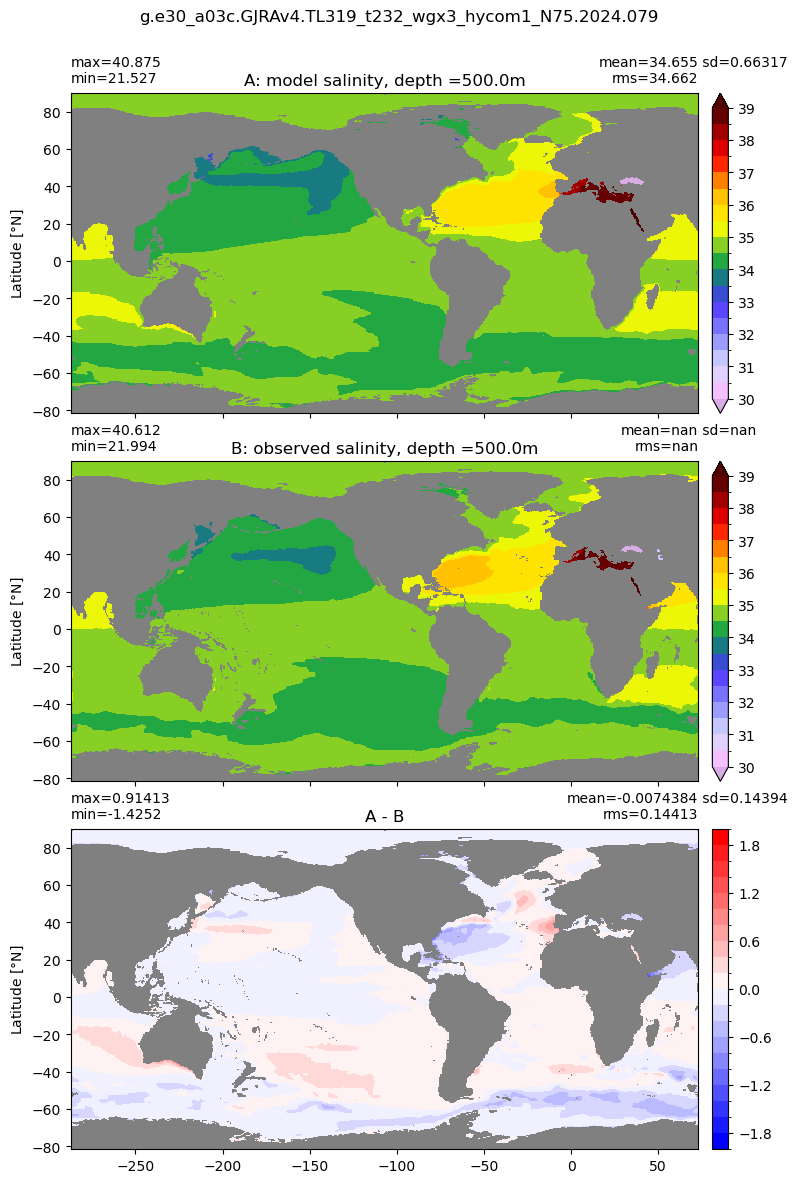
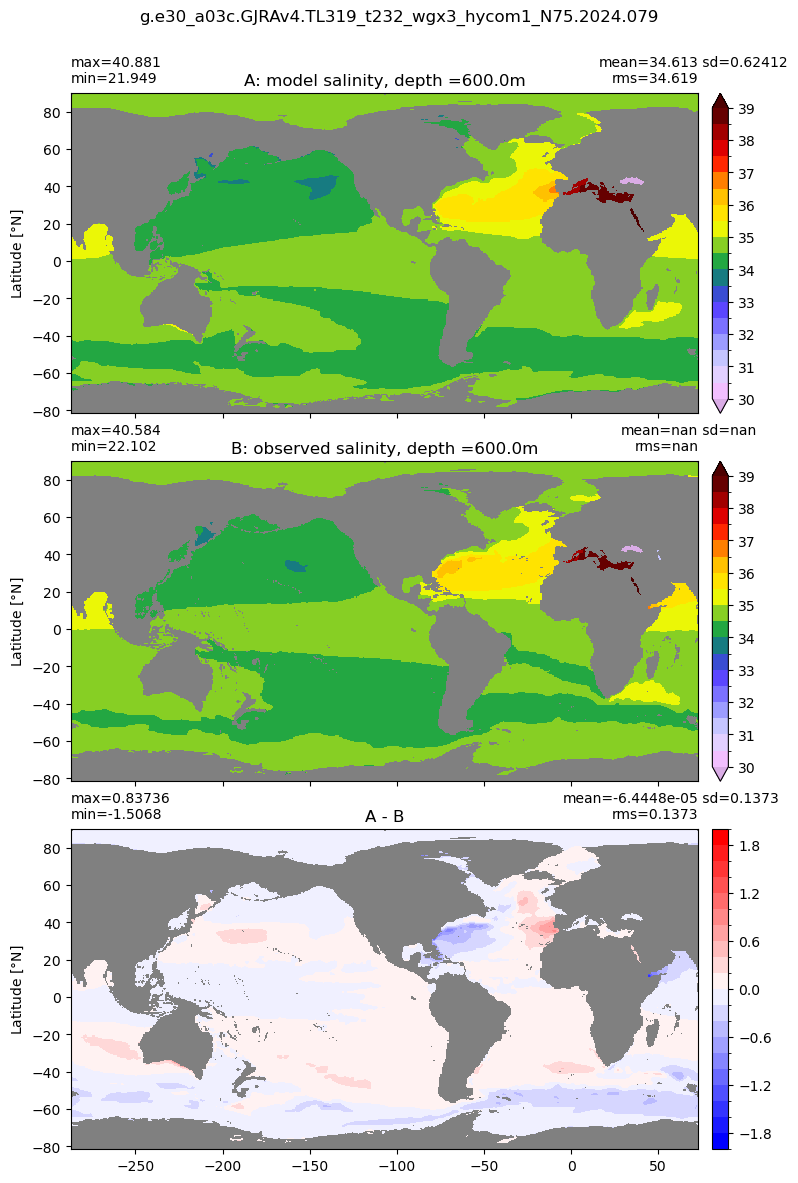
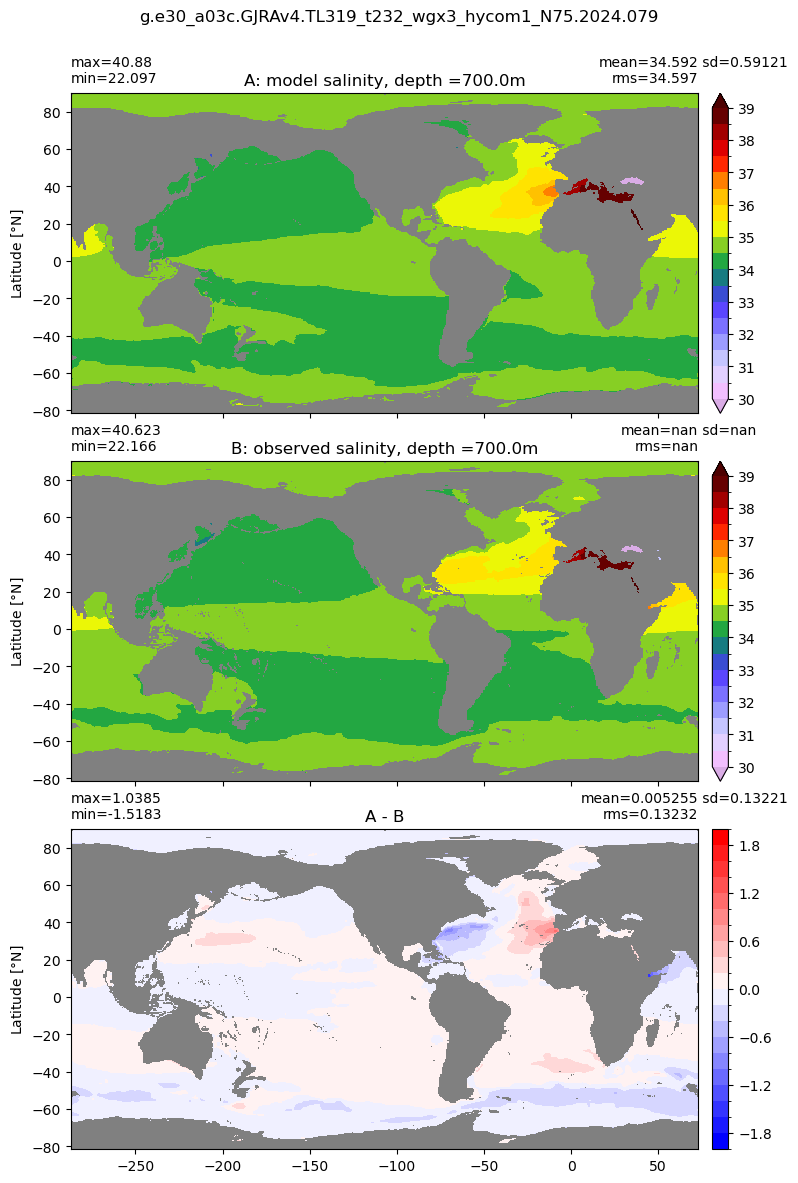
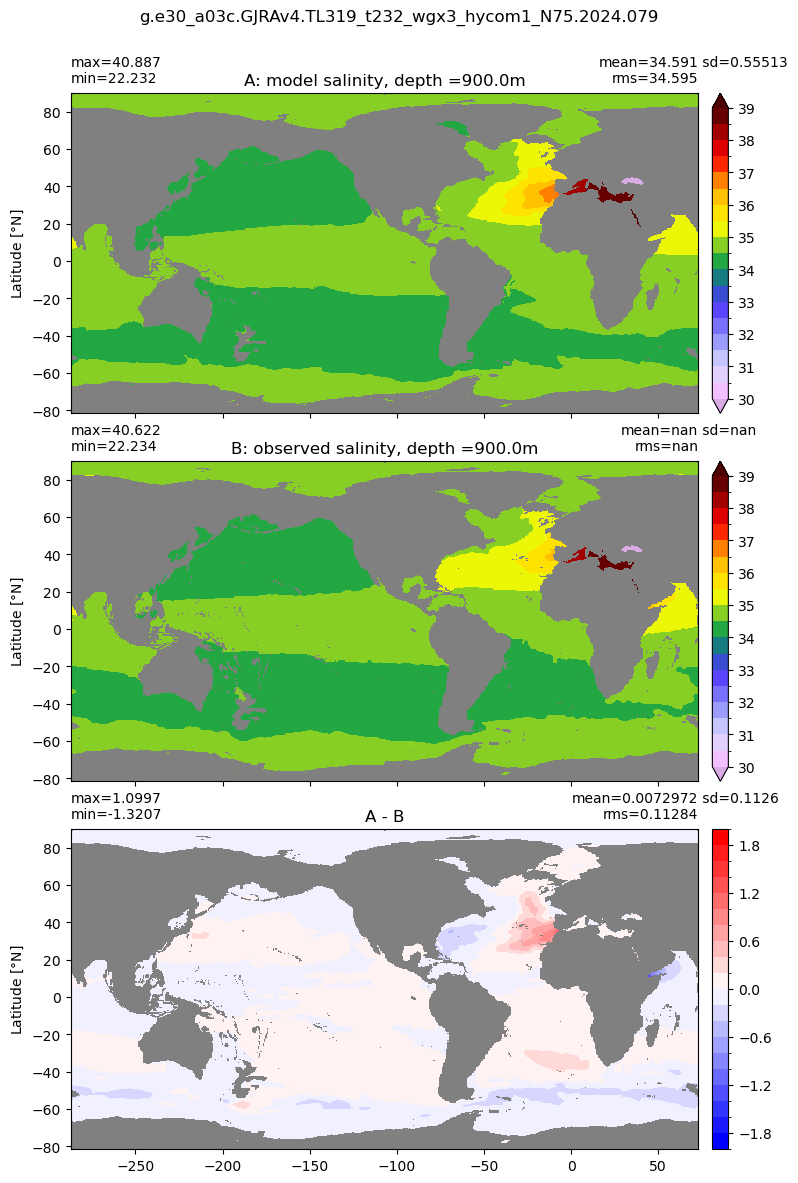
salt_obs = np.ma.masked_invalid(woa18['so'][k,:].values)
xycompare( salt[k,:] , salt_obs, grd.geolon, grd.geolat, area=area,
title1 = 'model salinity, depth ='+str(ds['z_l'][k].values)+ 'm',
title2 = 'observed salinity, depth ='+str(woa18['depth'][k].values)+ 'm',
suptitle=casename, clim=(30,39.), dcolormap=plt.cm.bwr,
extend='both', dextend='neither', dlim=(-2,2),
show= True)


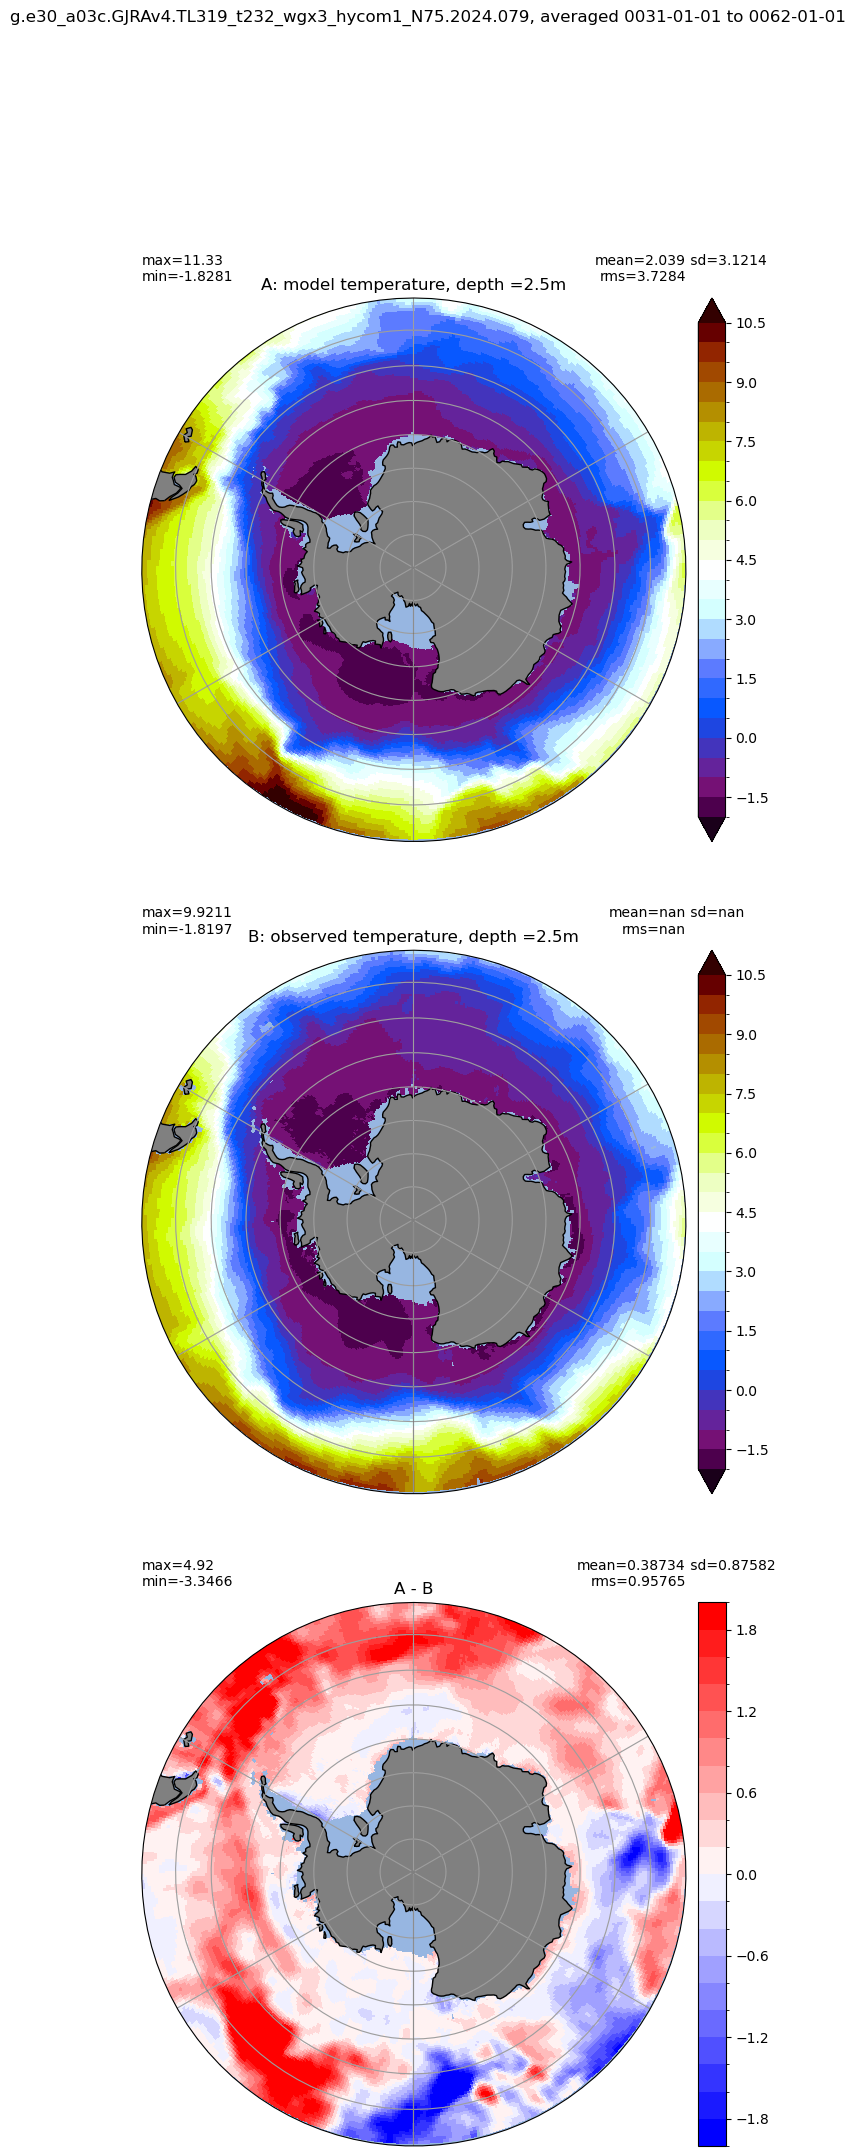
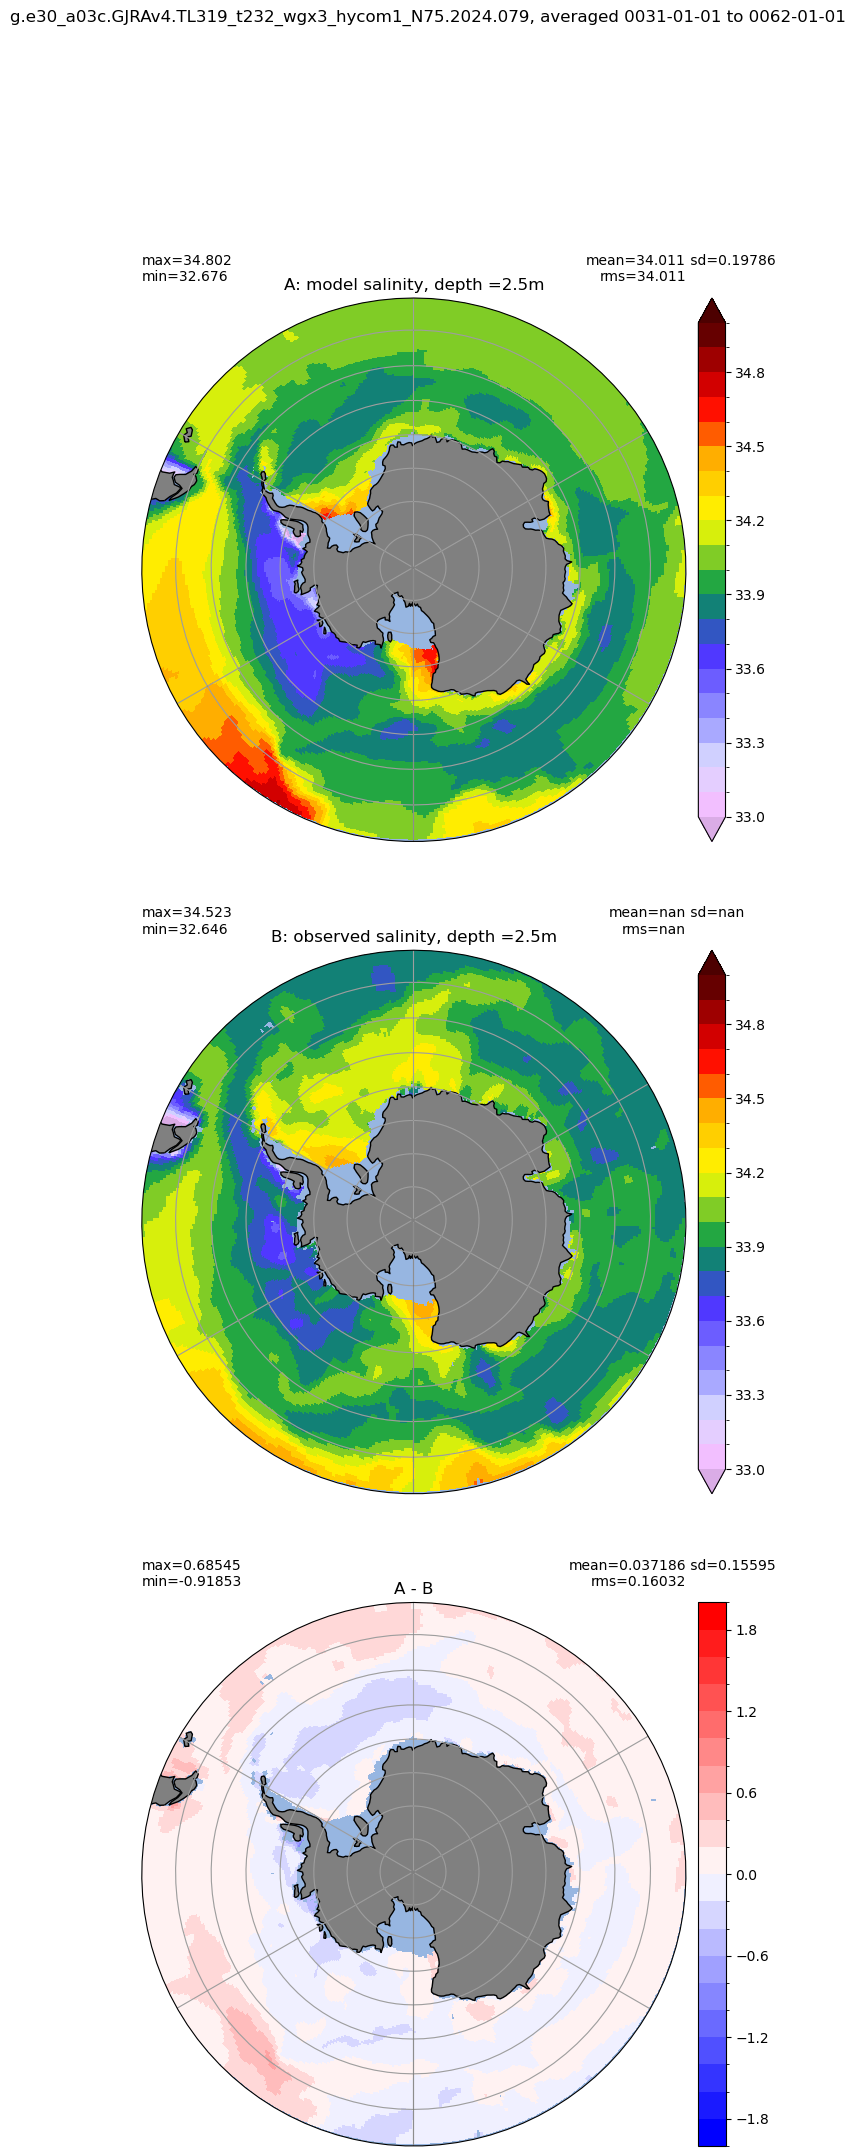
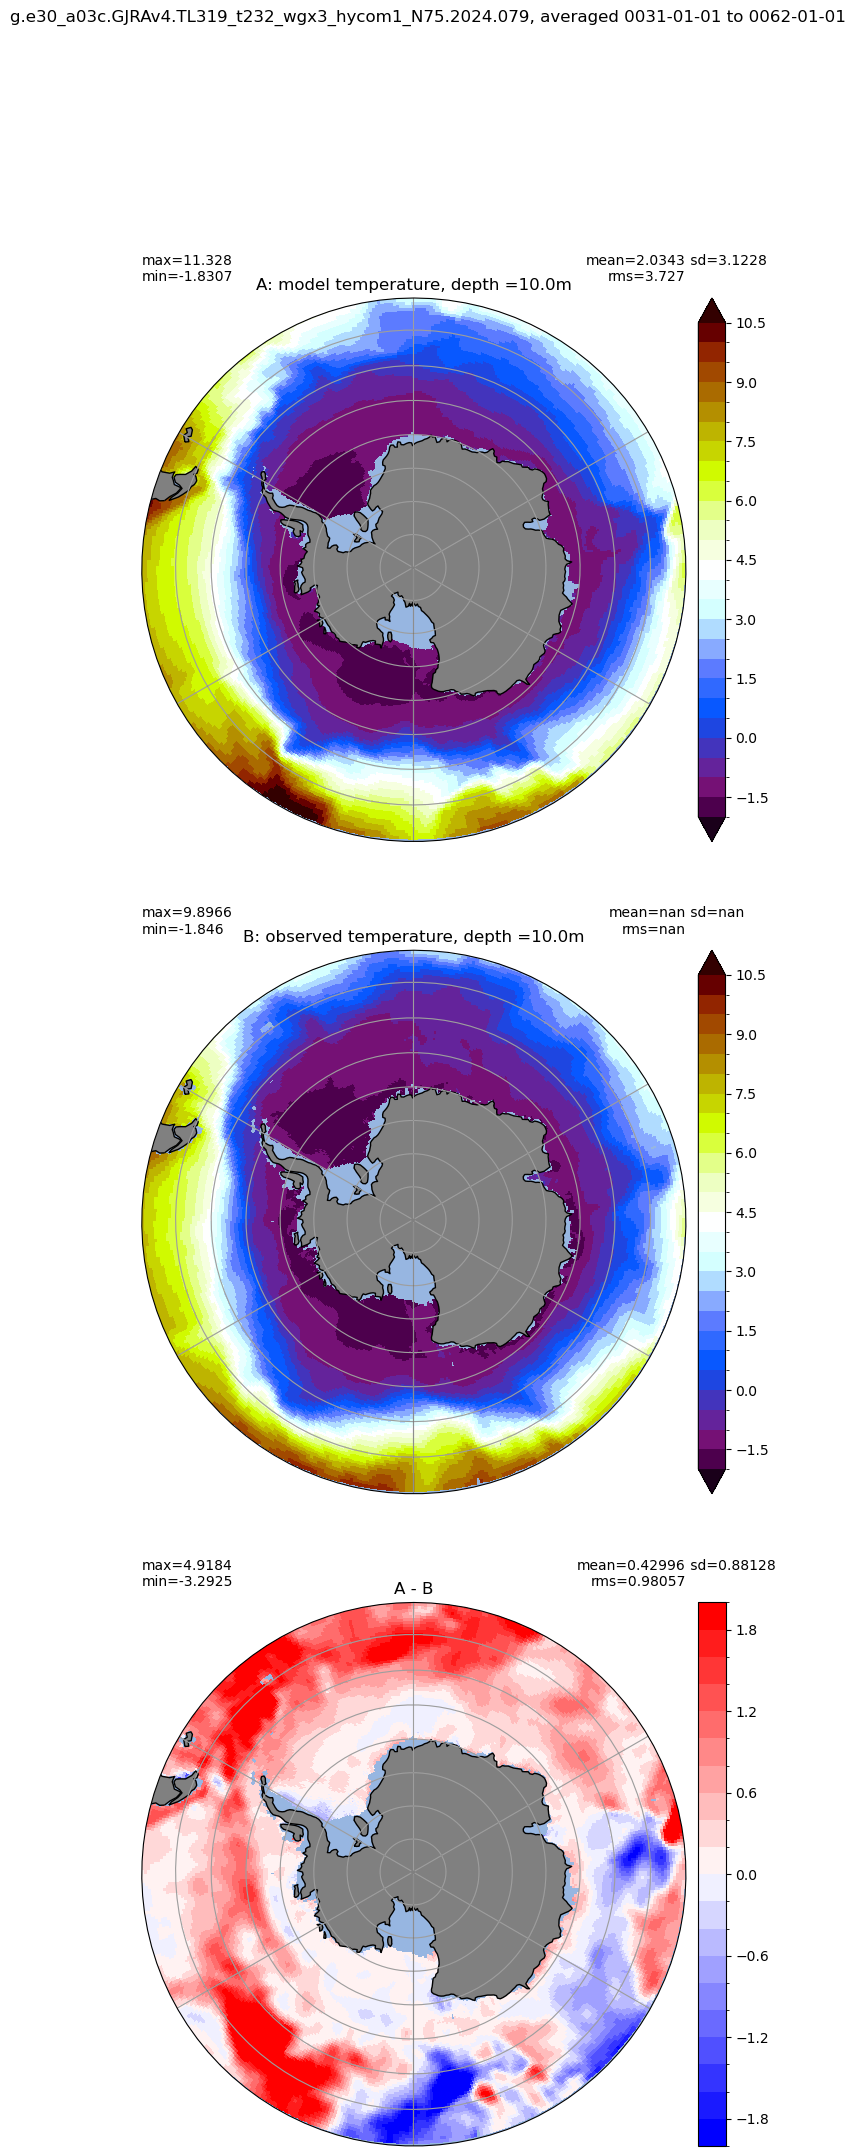
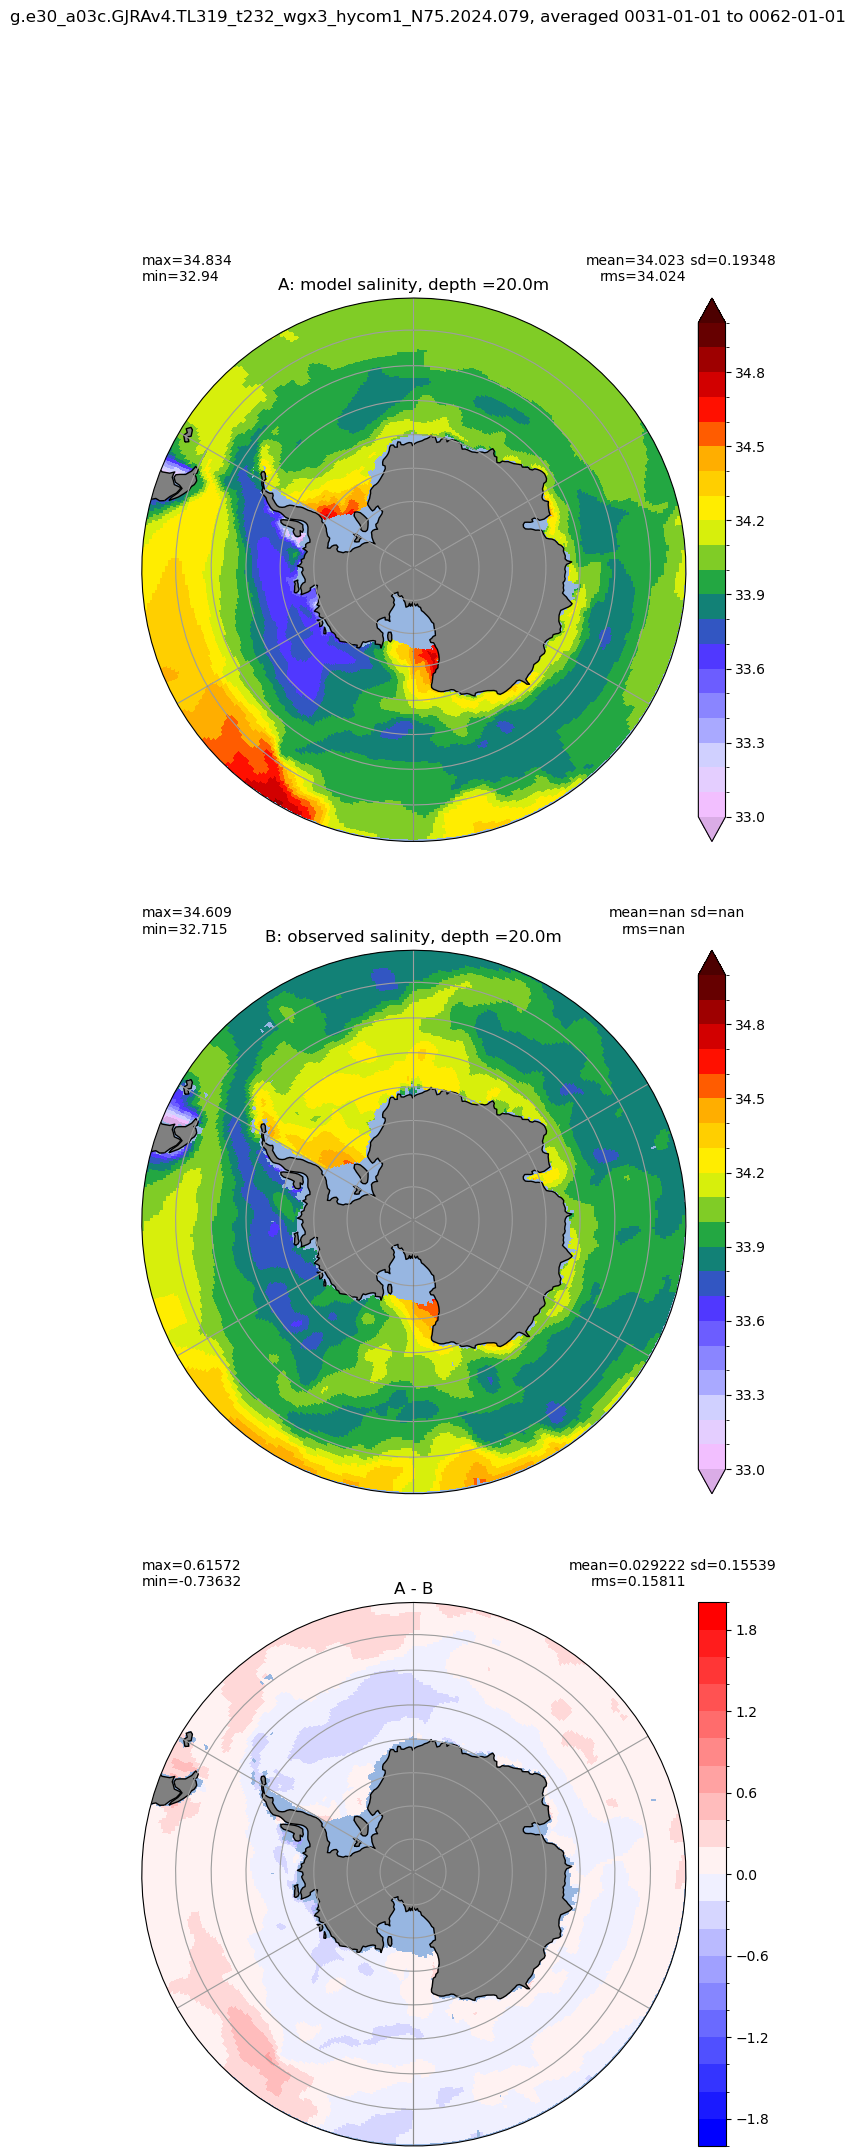
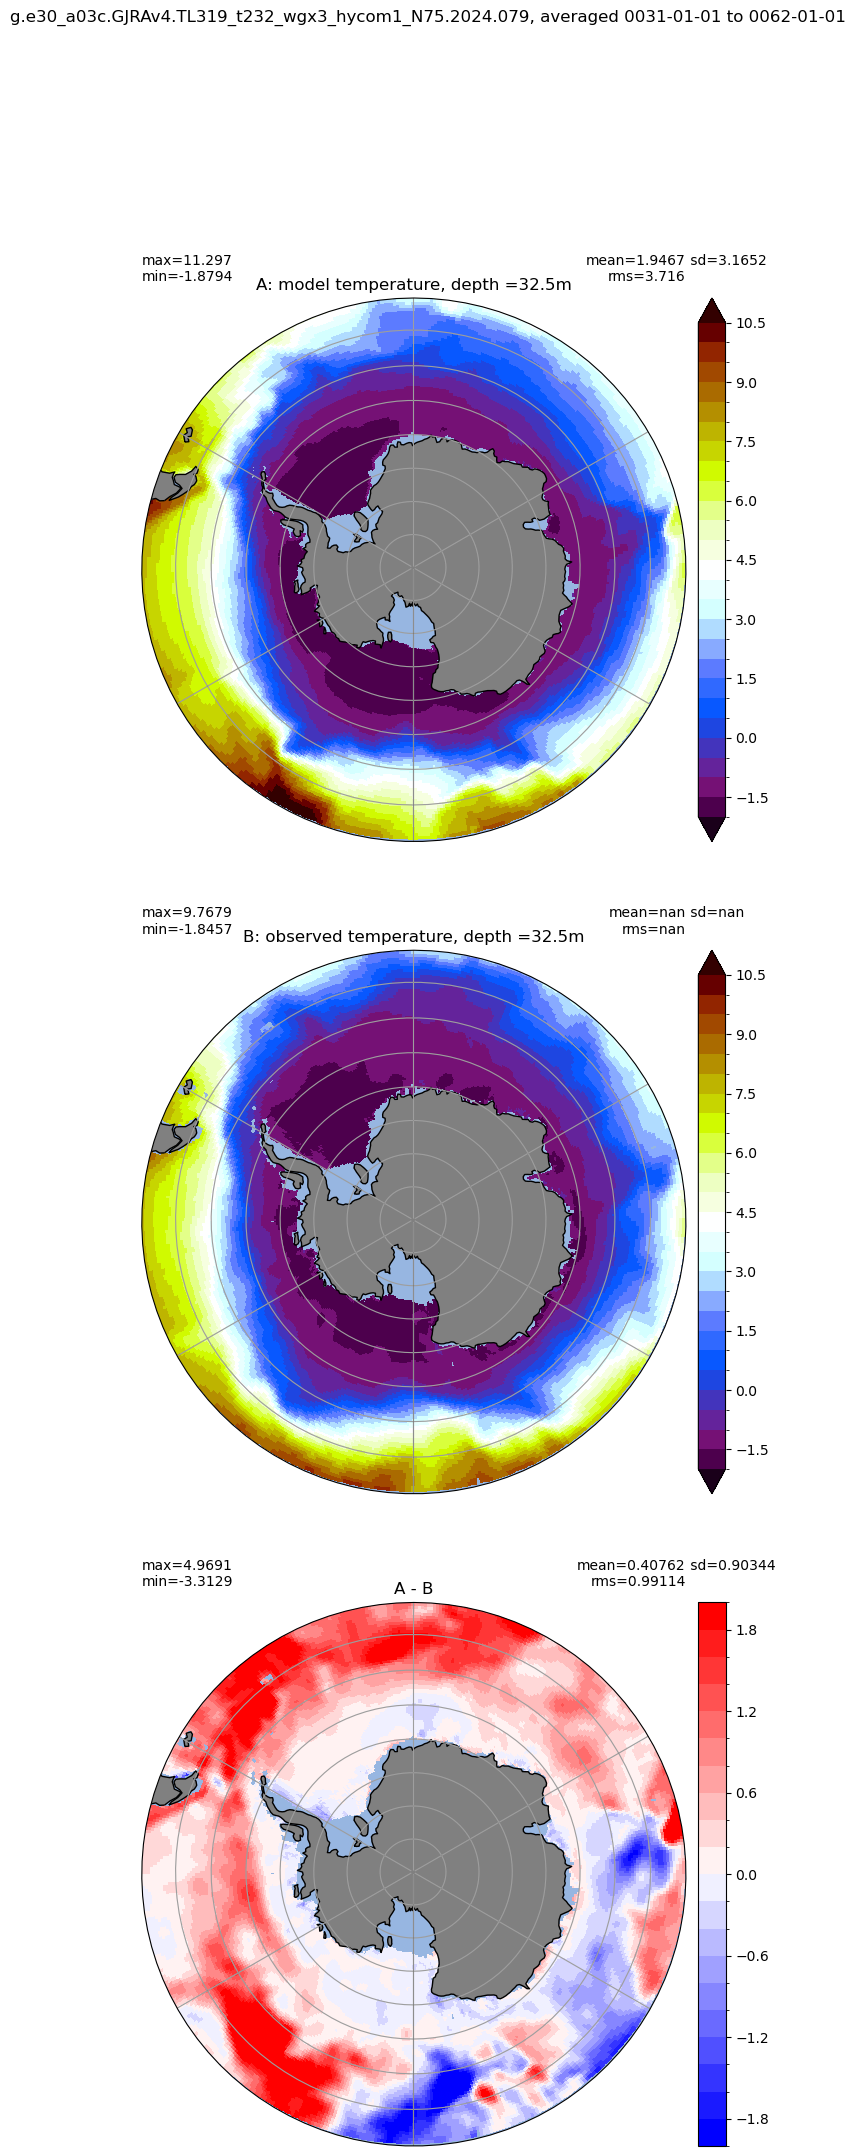
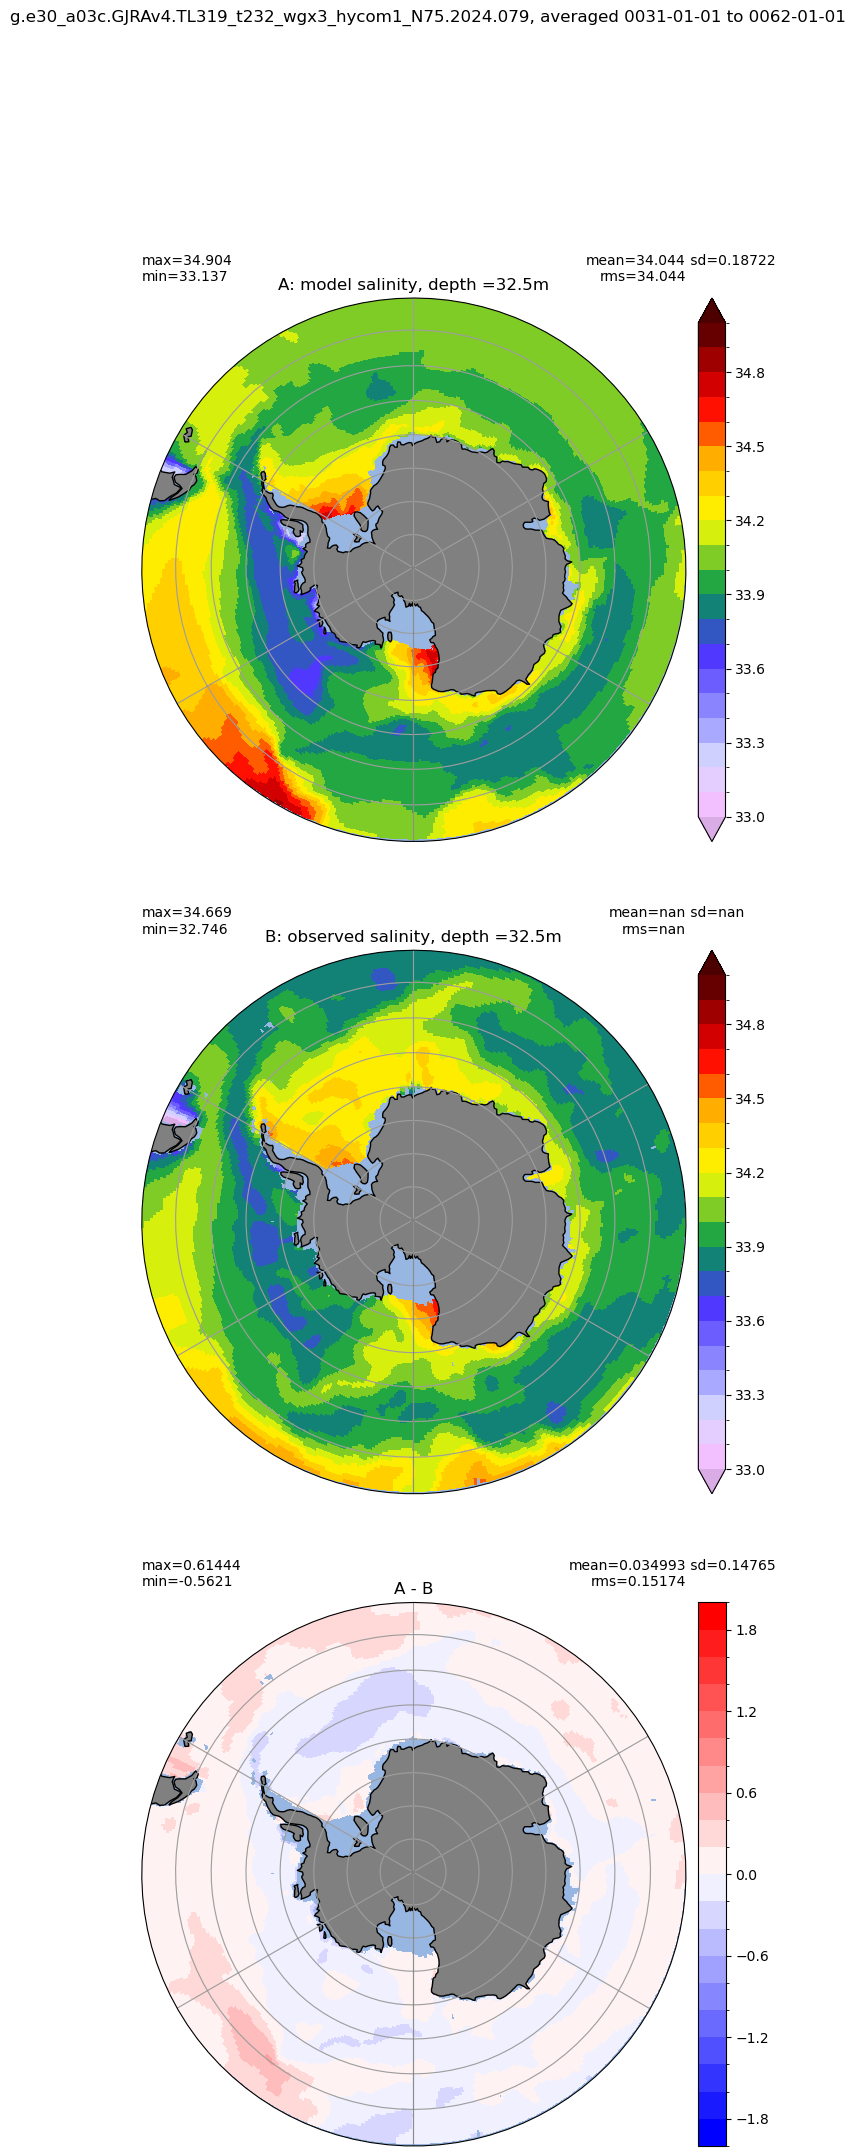
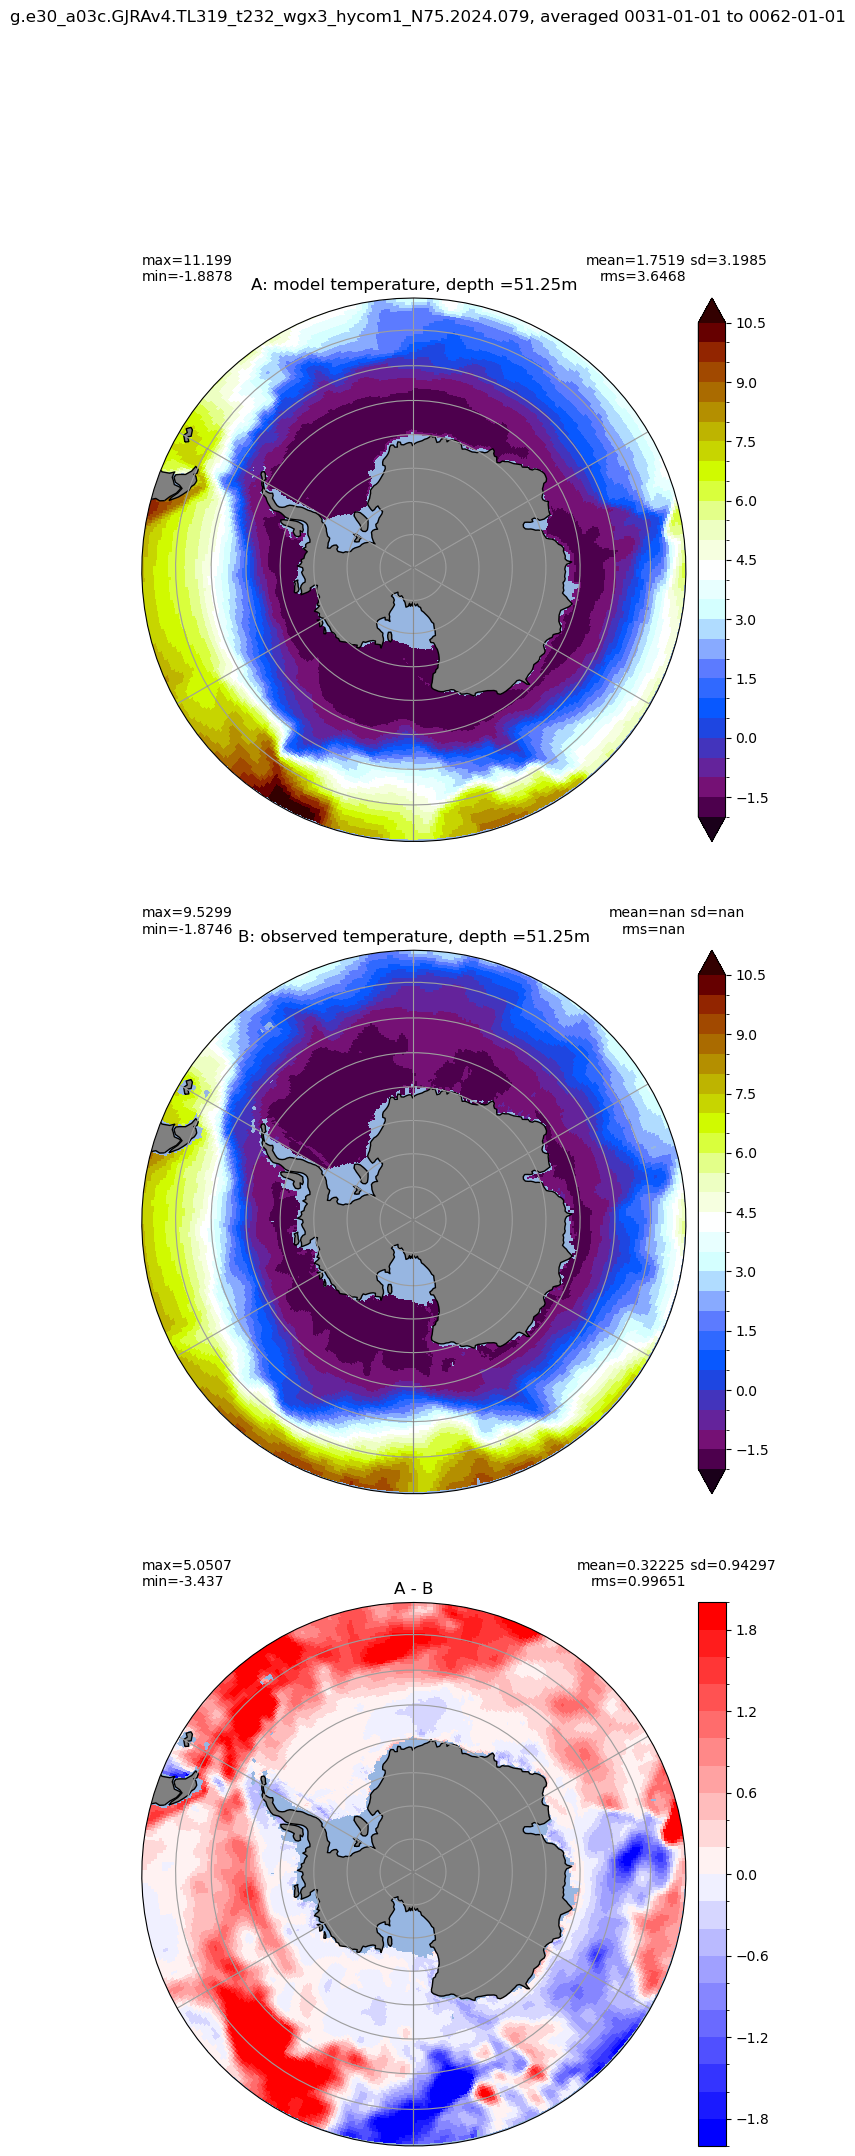
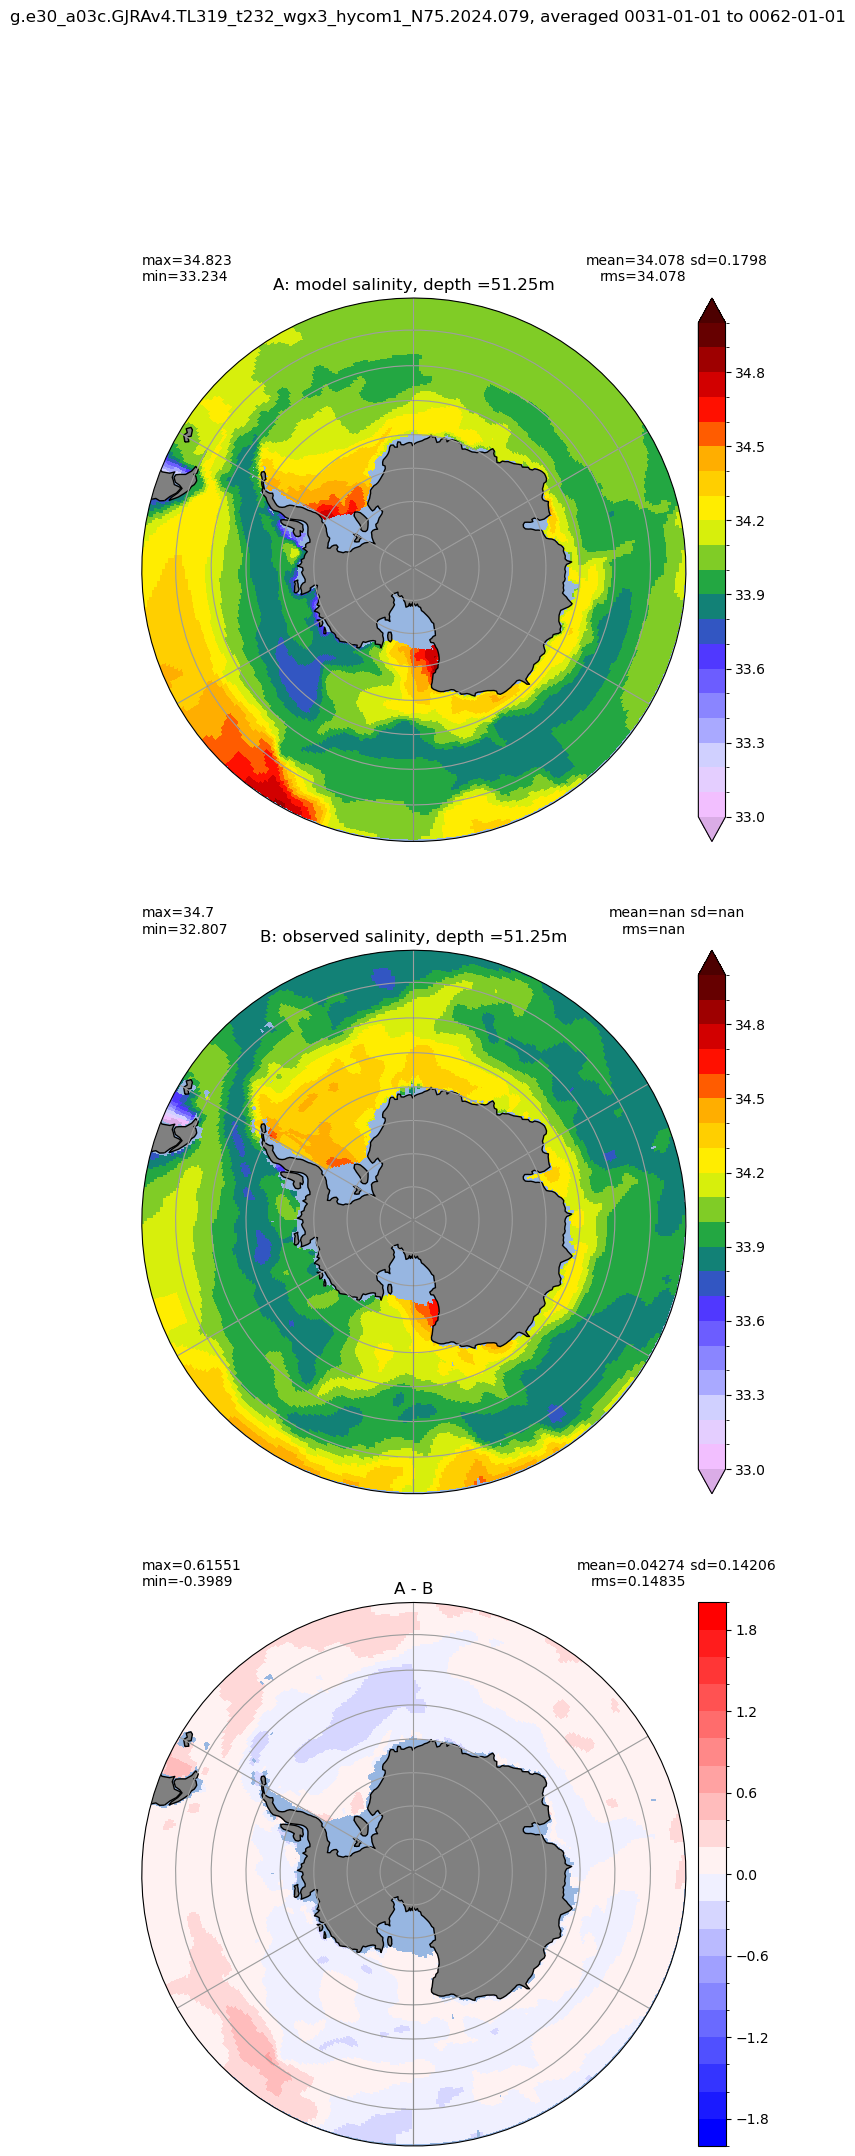
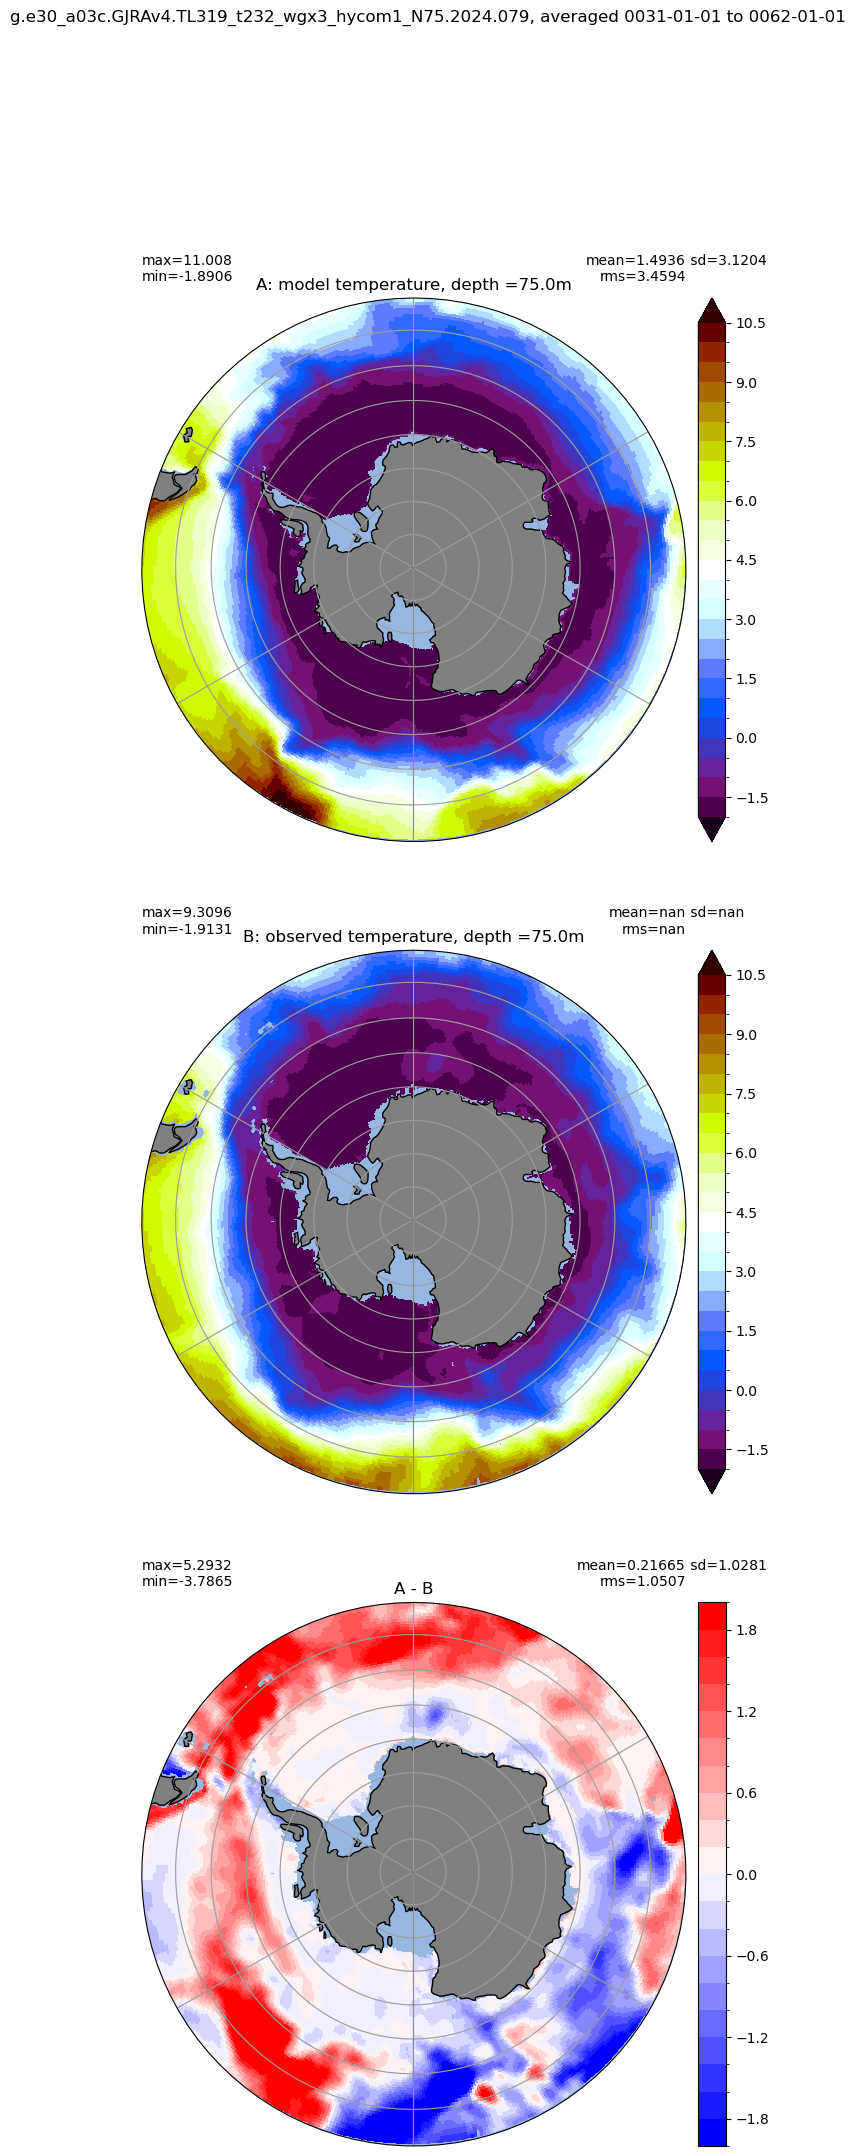
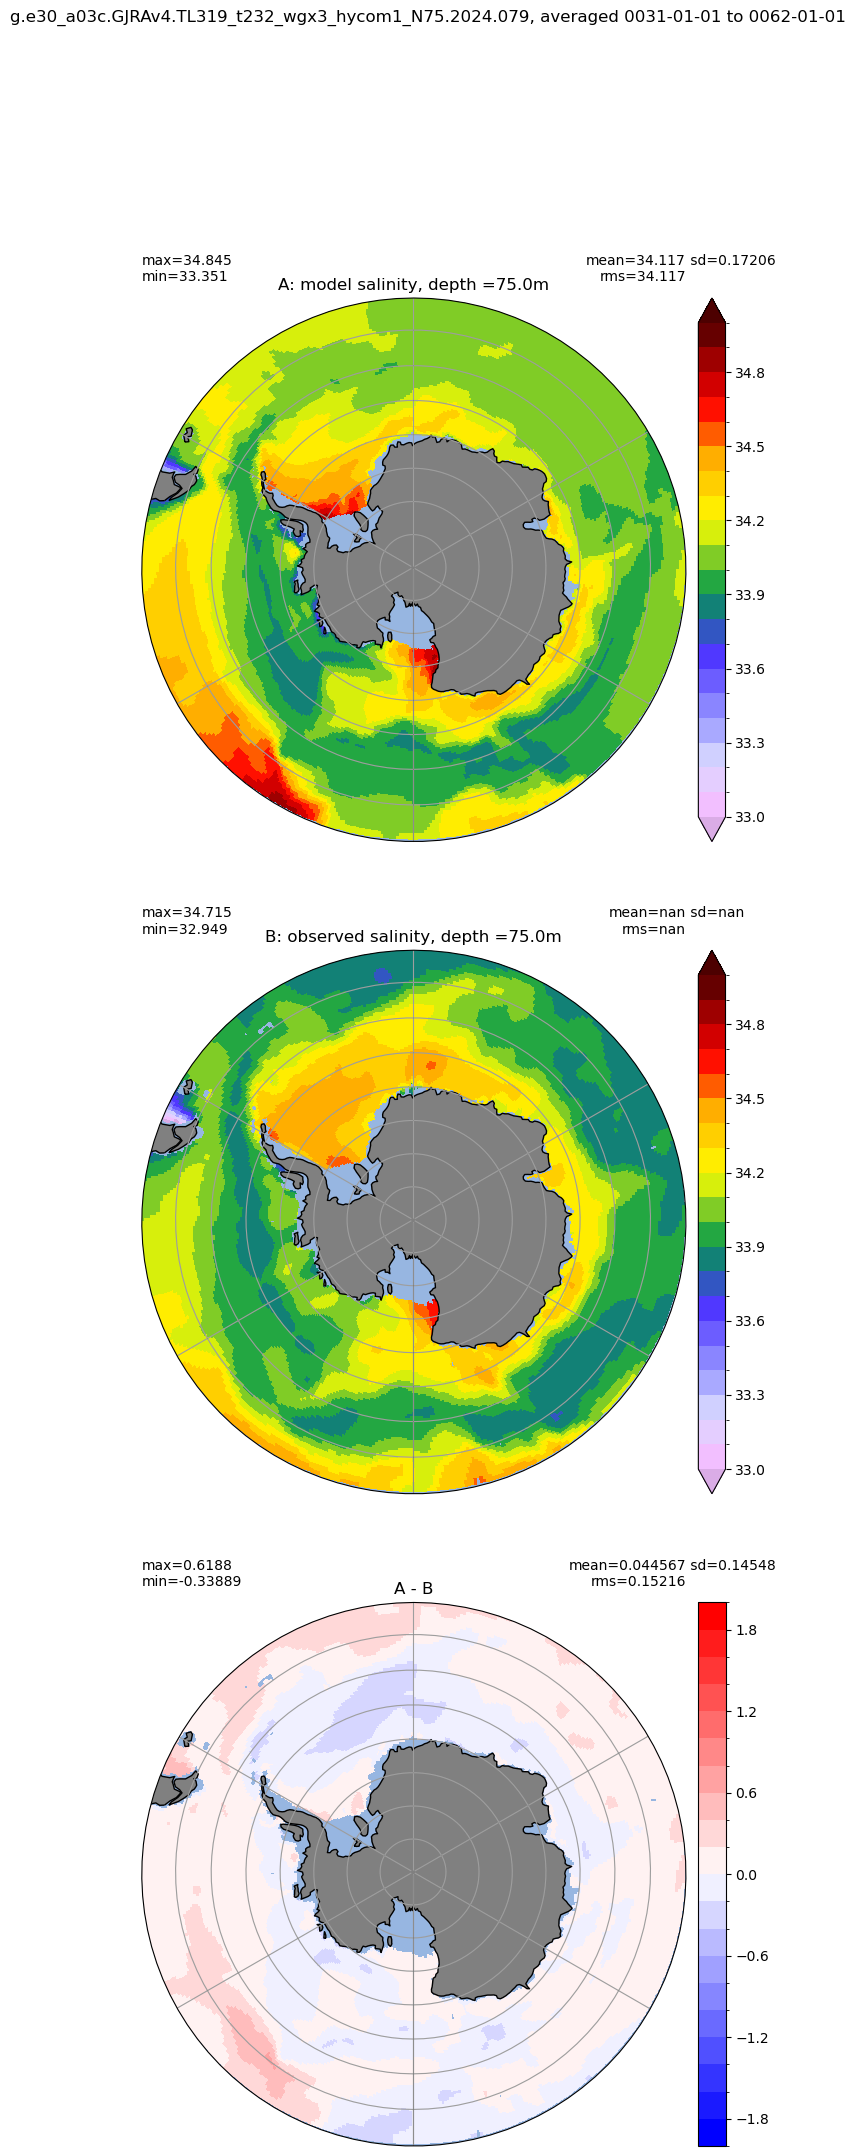
Antarctic
[20]:
# loop over depths and compare TS fields
km = len(woa18['depth'])
for k in range(km):
  if (ds['z_l'][k].values < 100.):
    temp_obs = np.ma.masked_invalid(woa18['thetao'][k,:].values)
    polarcomparison(temp[k,:] , temp_obs, grd,
              title1 = 'model temperature, depth ='+str(ds['z_l'][k].values)+ 'm',
              title2 = 'observed temperature, depth ='+str(woa18['depth'][k].values)+ 'm',
              extend='both', dextend='neither', clim=(-1.9,10.5), dlim=(-2,2), dcolormap=plt.cm.bwr,
              suptitle=casename + ', averaged '+str(args.start_date)+ ' to ' +str(args.end_date),
              proj='SP', show= True)

    salt_obs = np.ma.masked_invalid(woa18['so'][k,:].values)
    polarcomparison( salt[k,:] , salt_obs, grd,
              title1 = 'model salinity, depth ='+str(ds['z_l'][k].values)+ 'm',
              title2 = 'observed salinity, depth ='+str(woa18['depth'][k].values)+ 'm',
              extend='both', dextend='neither', clim=(33.,35.), dlim=(-2,2), dcolormap=plt.cm.bwr,
              suptitle=casename + ', averaged '+str(args.start_date)+ ' to ' +str(args.end_date),
              proj='SP', show= True)


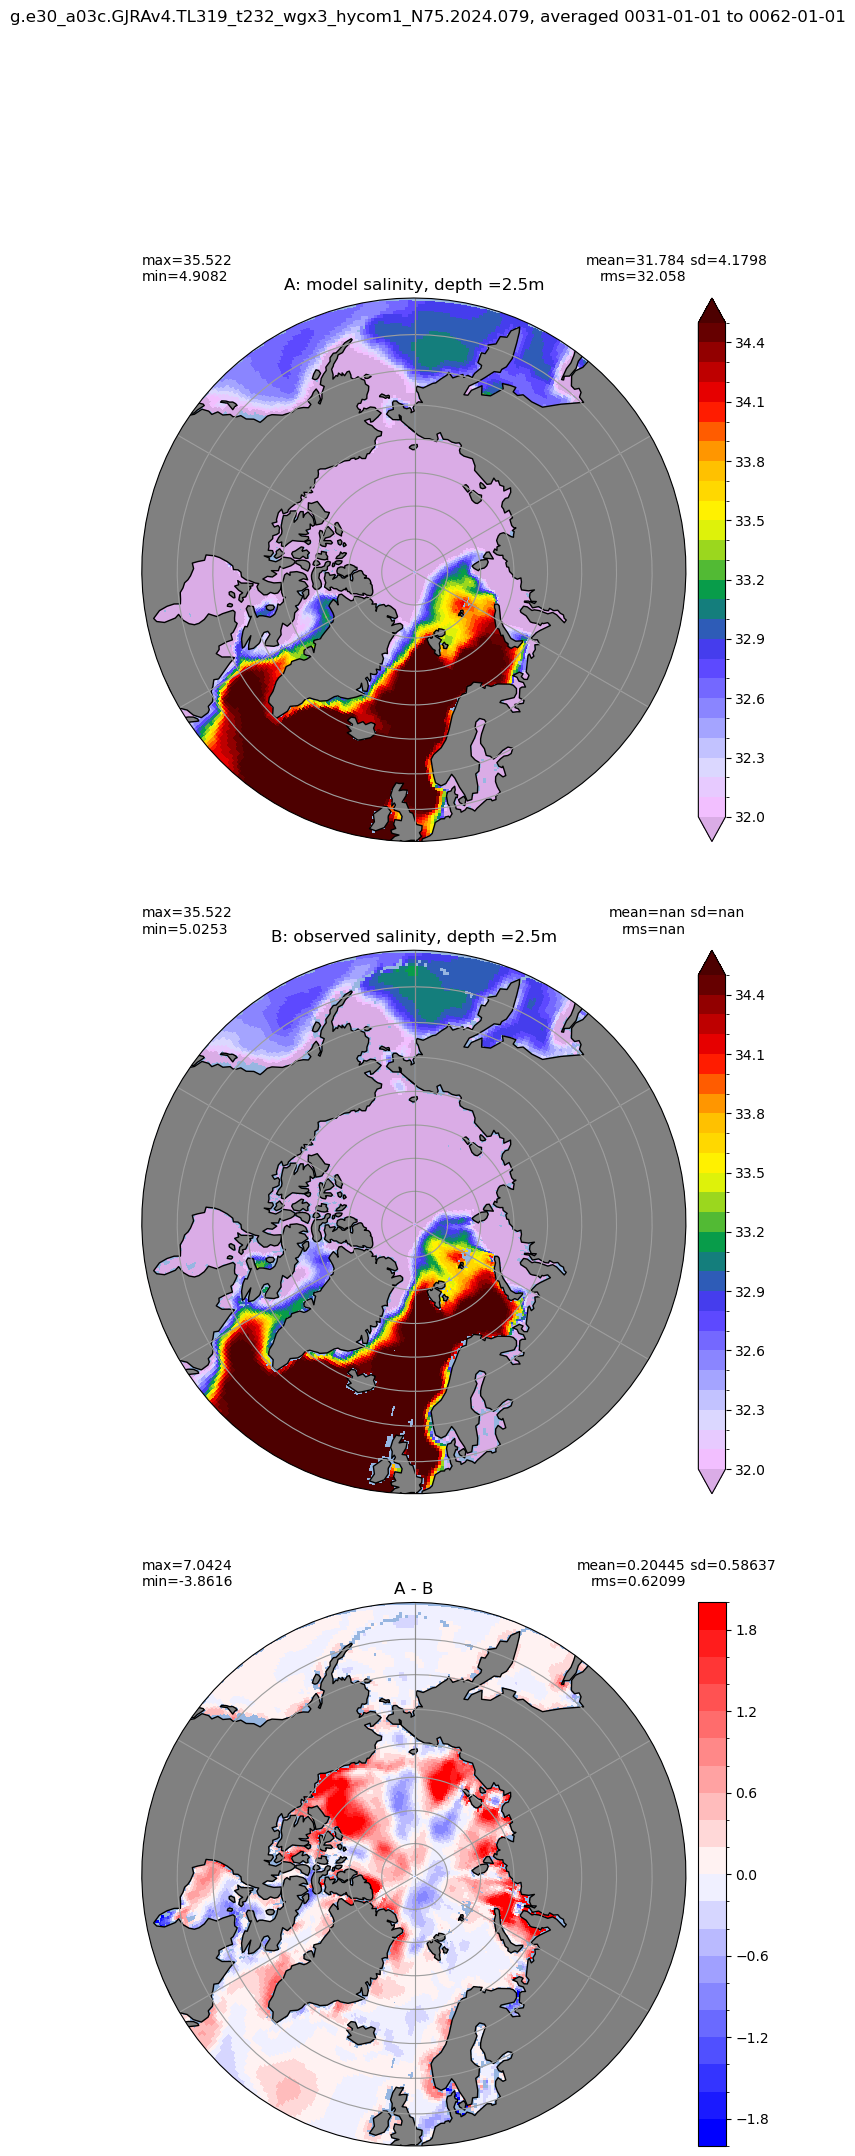
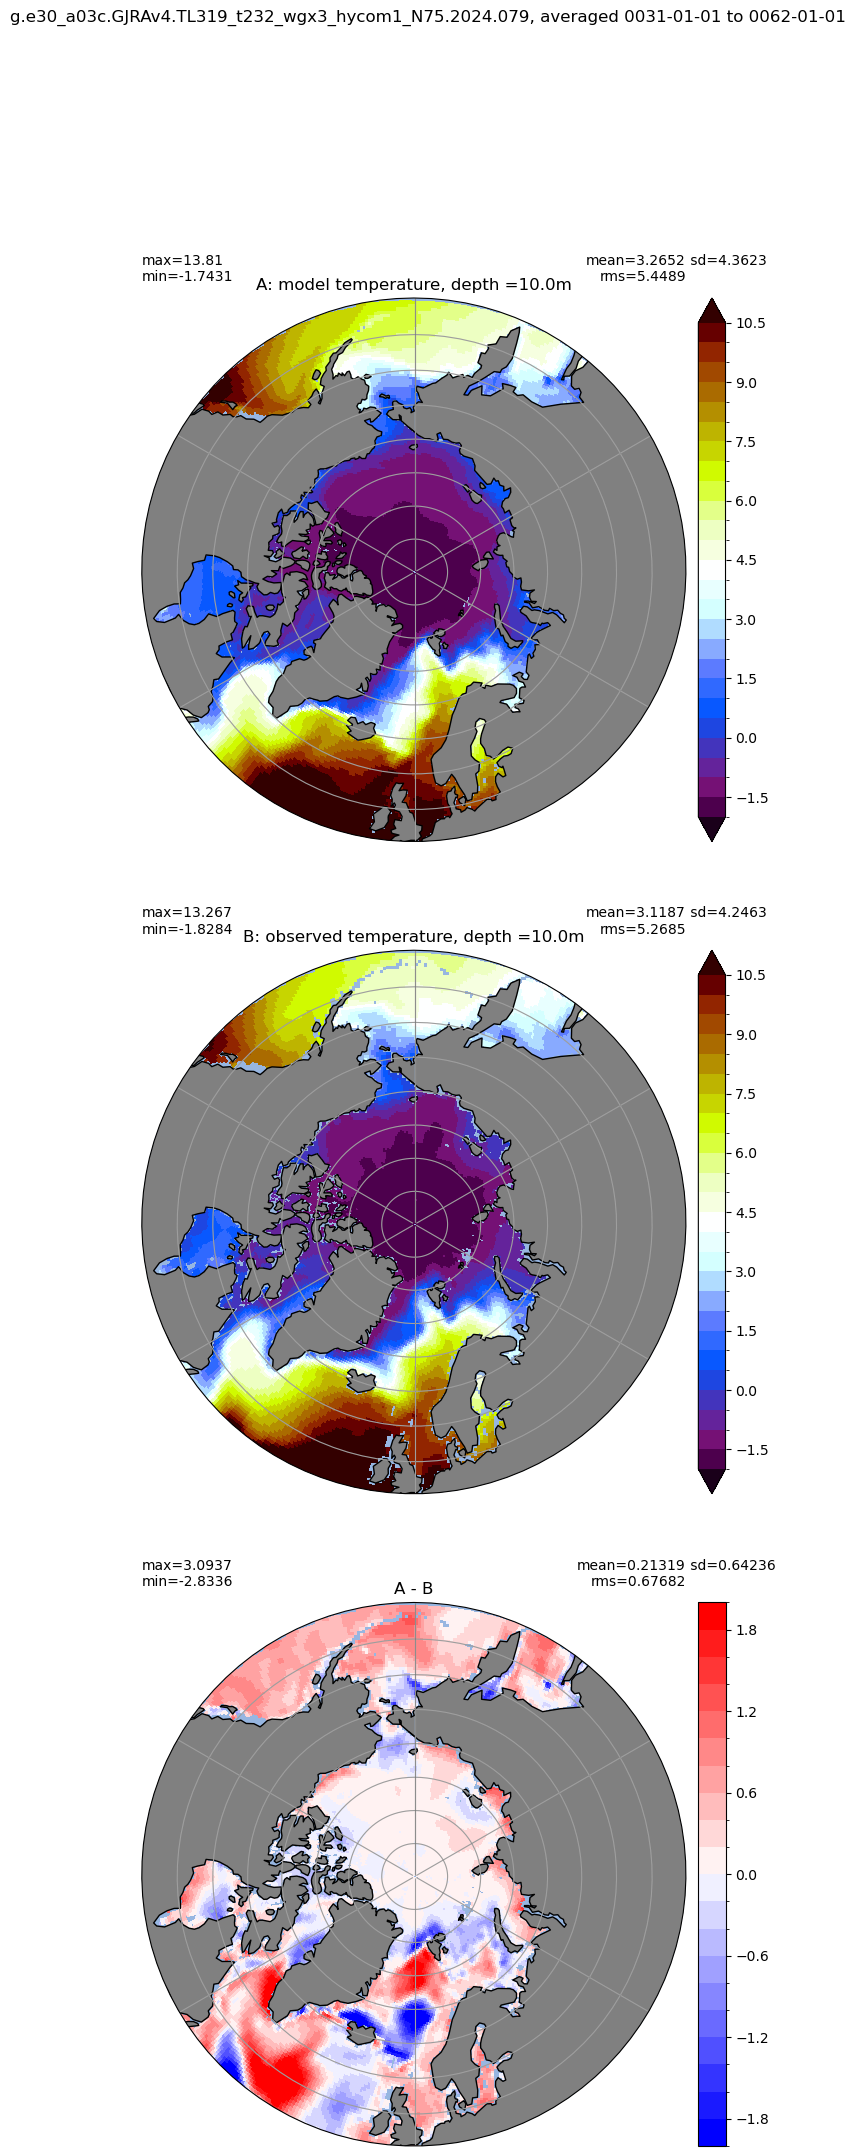
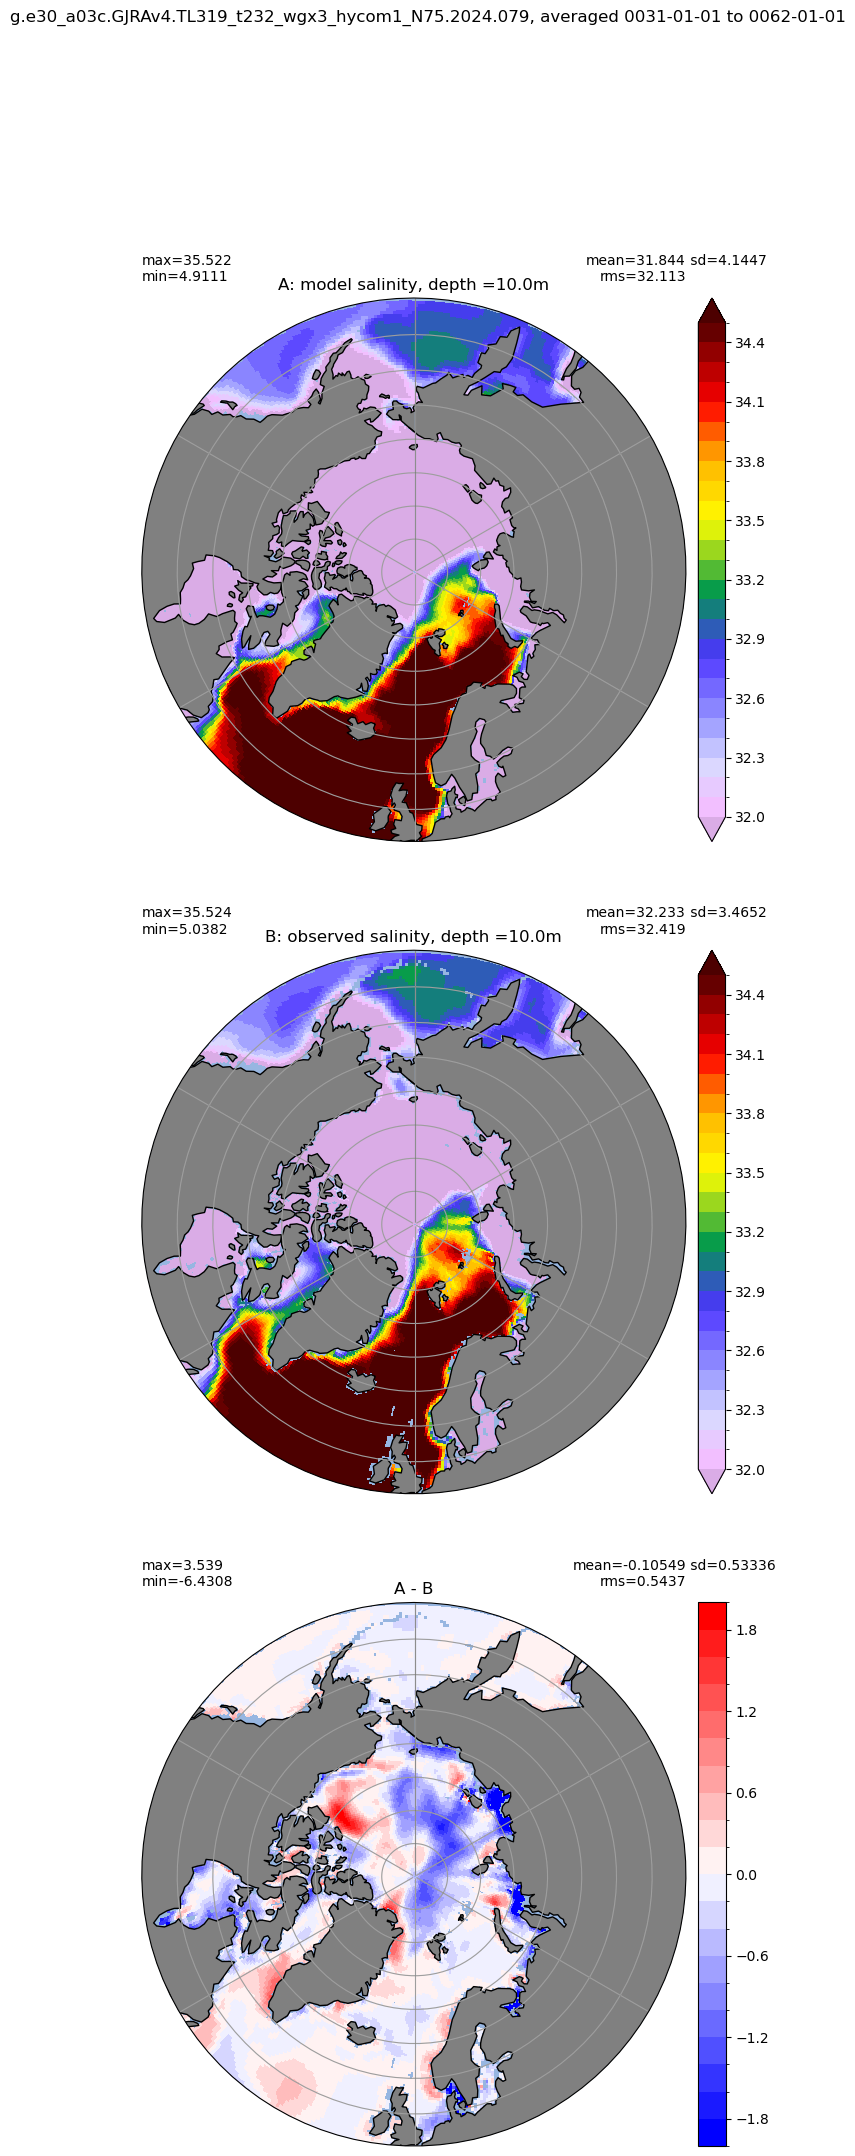
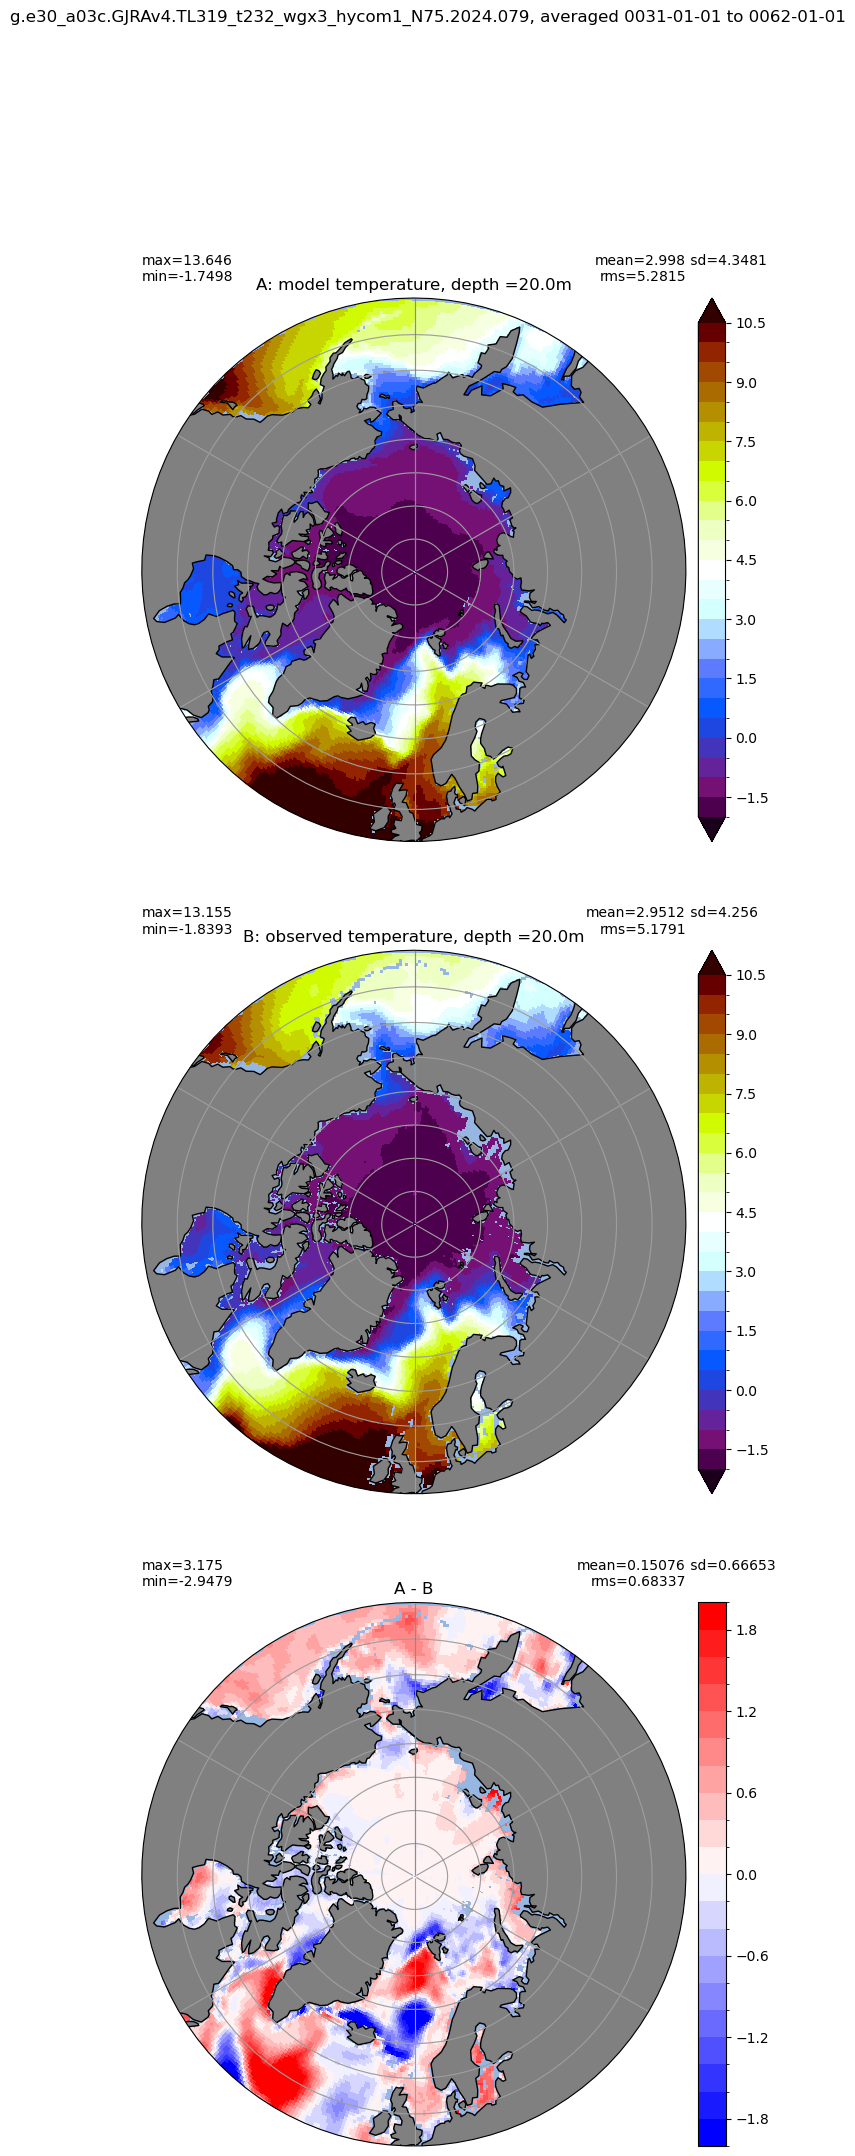
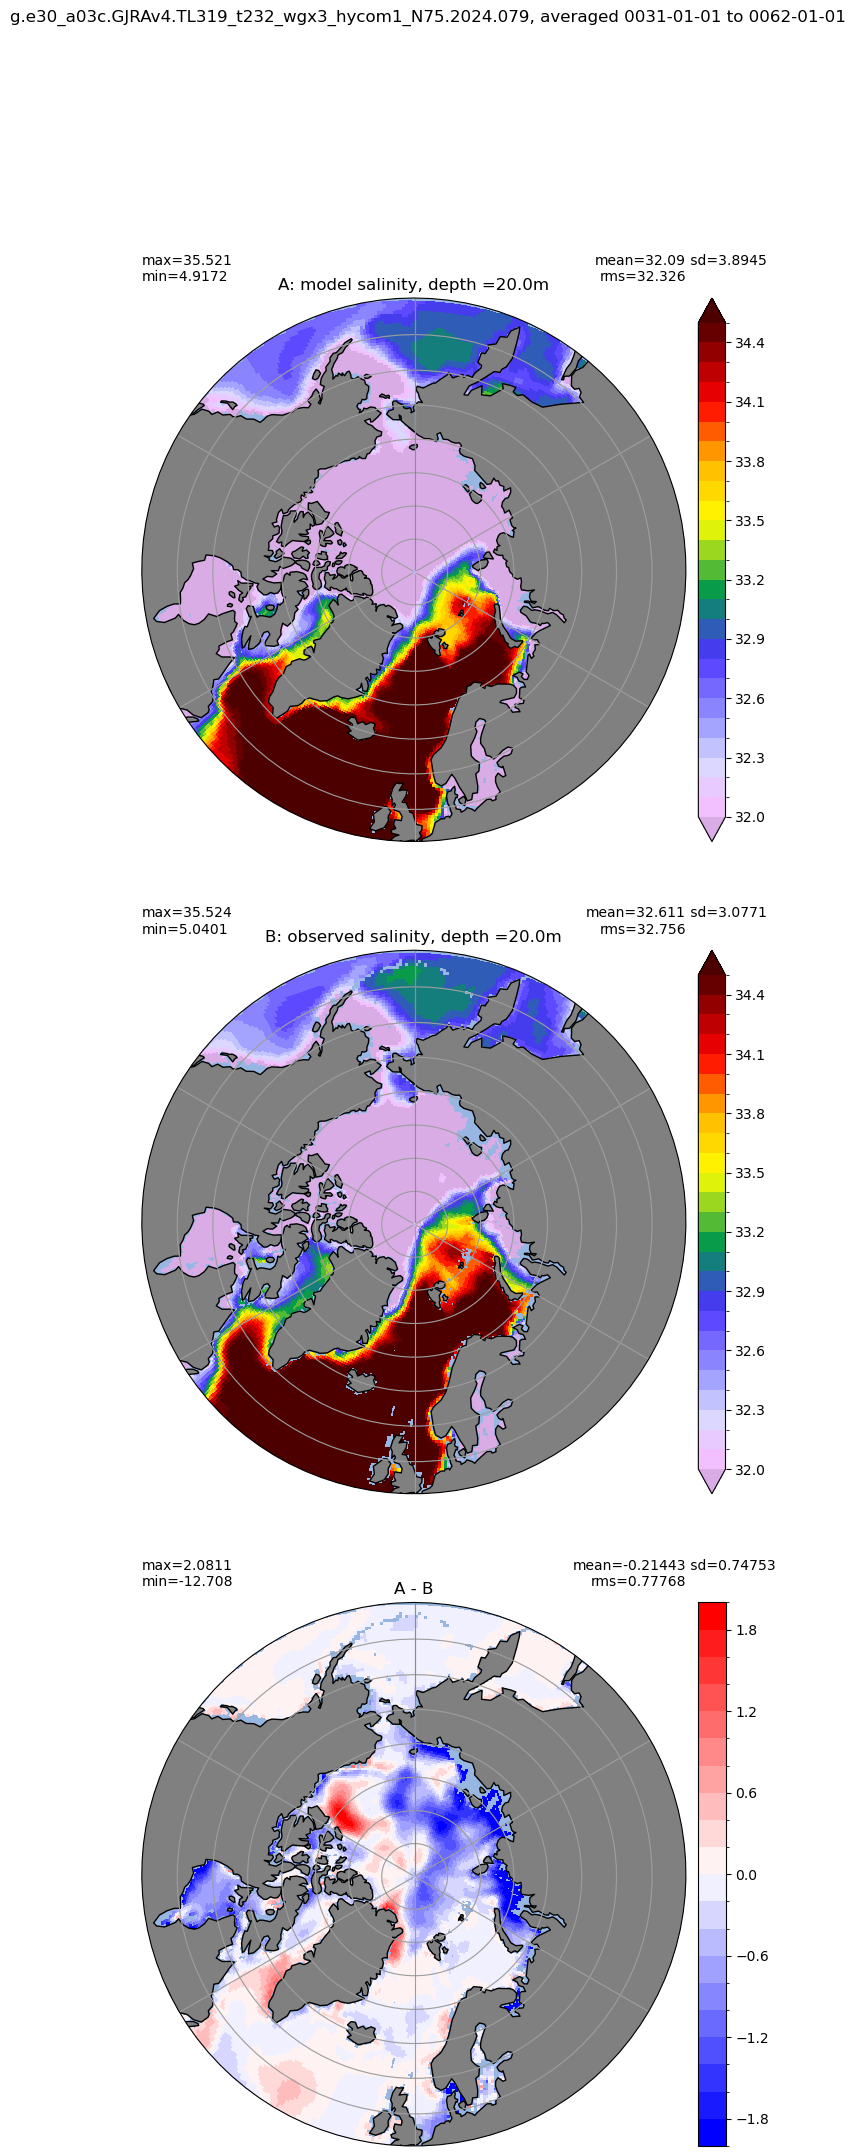
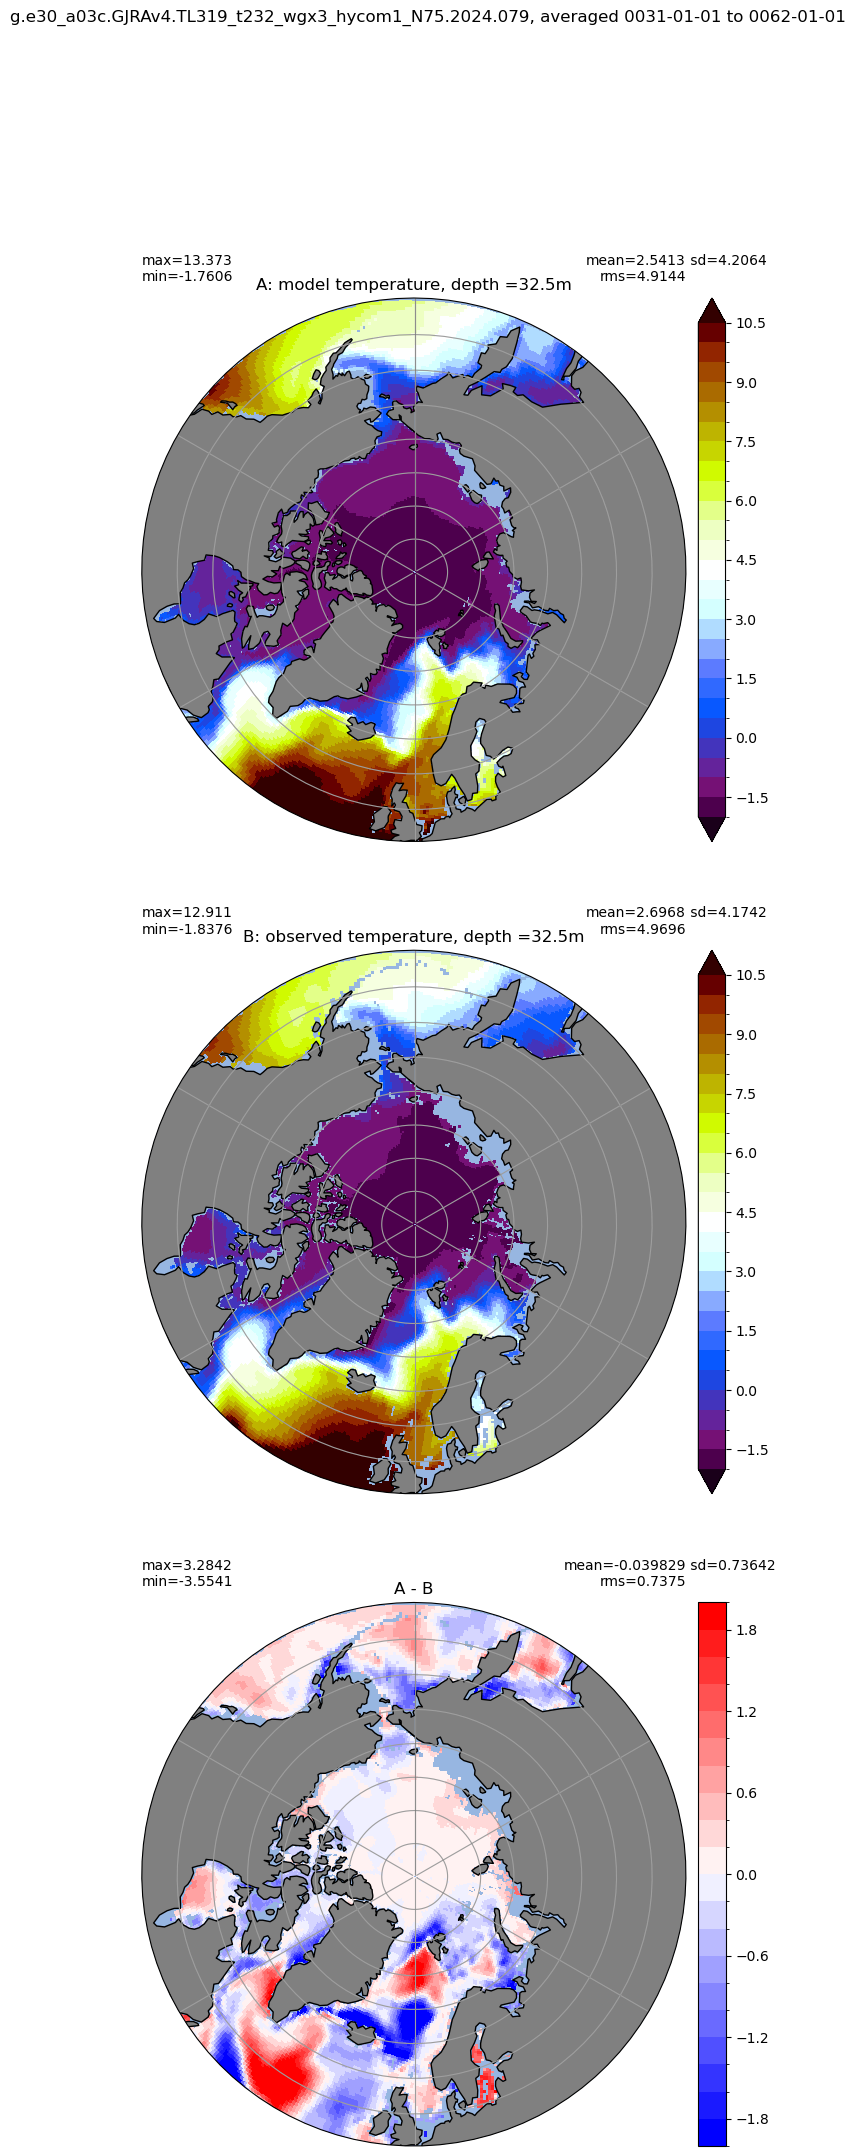
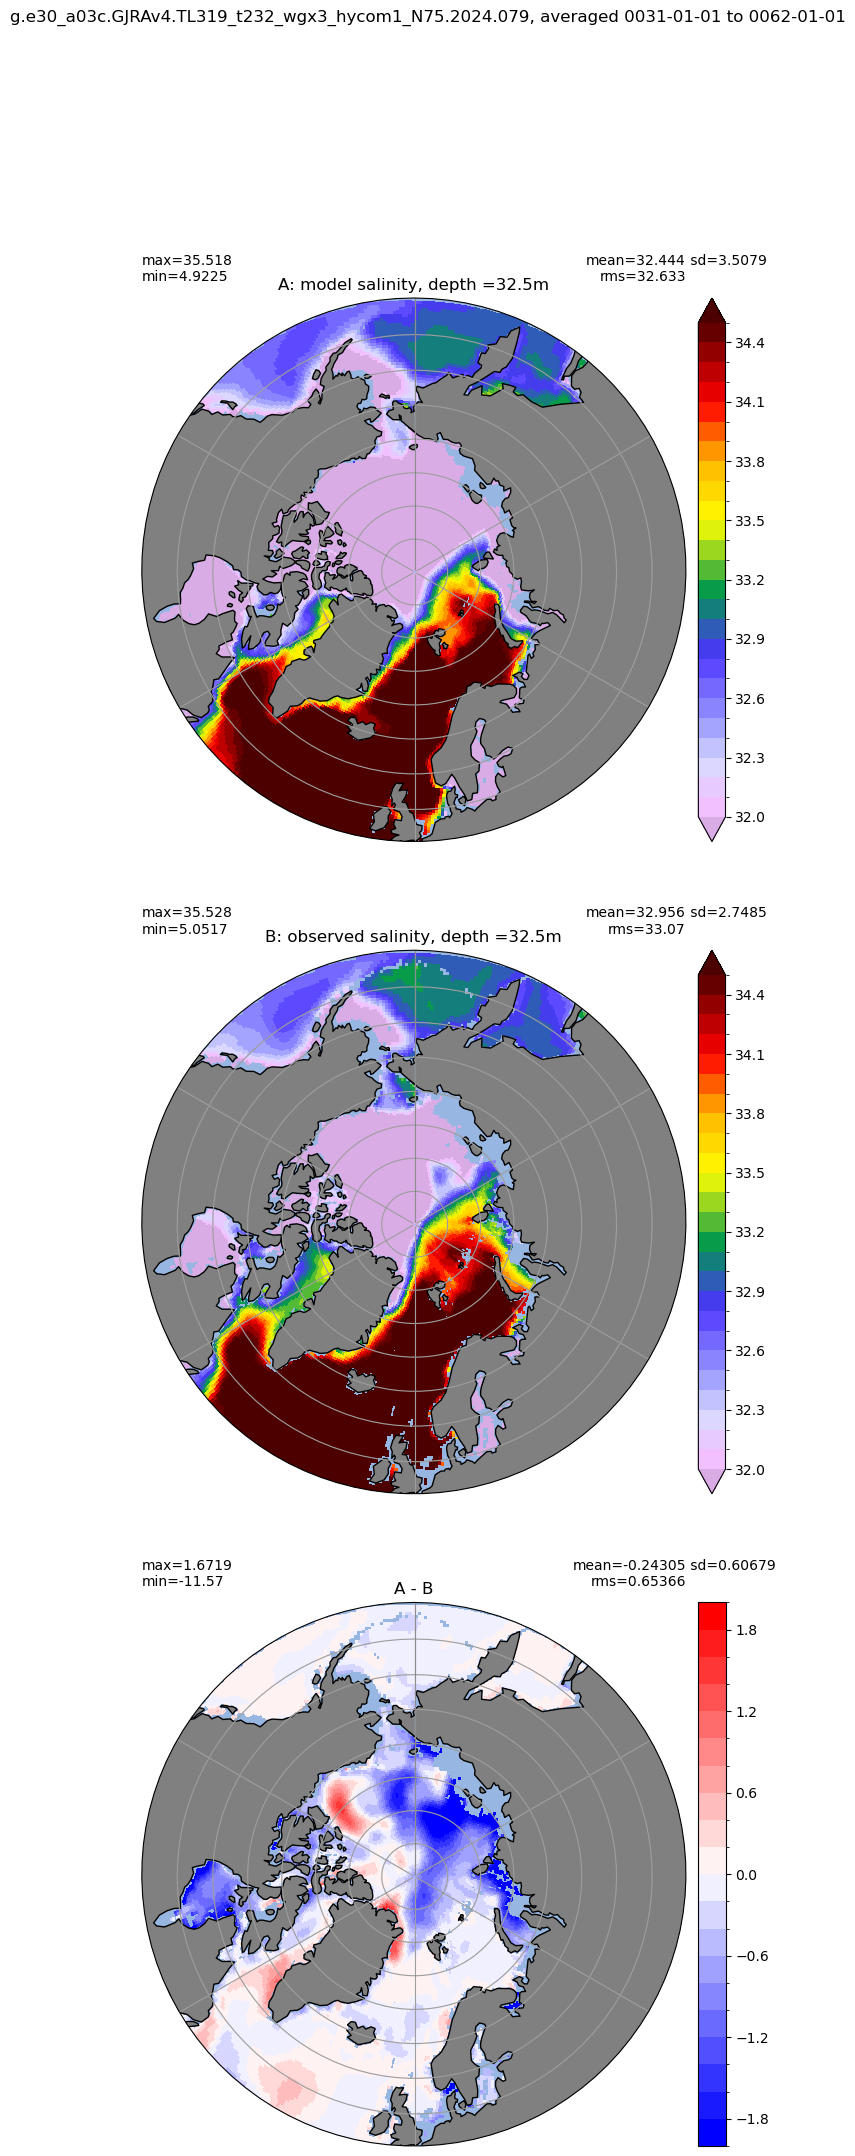
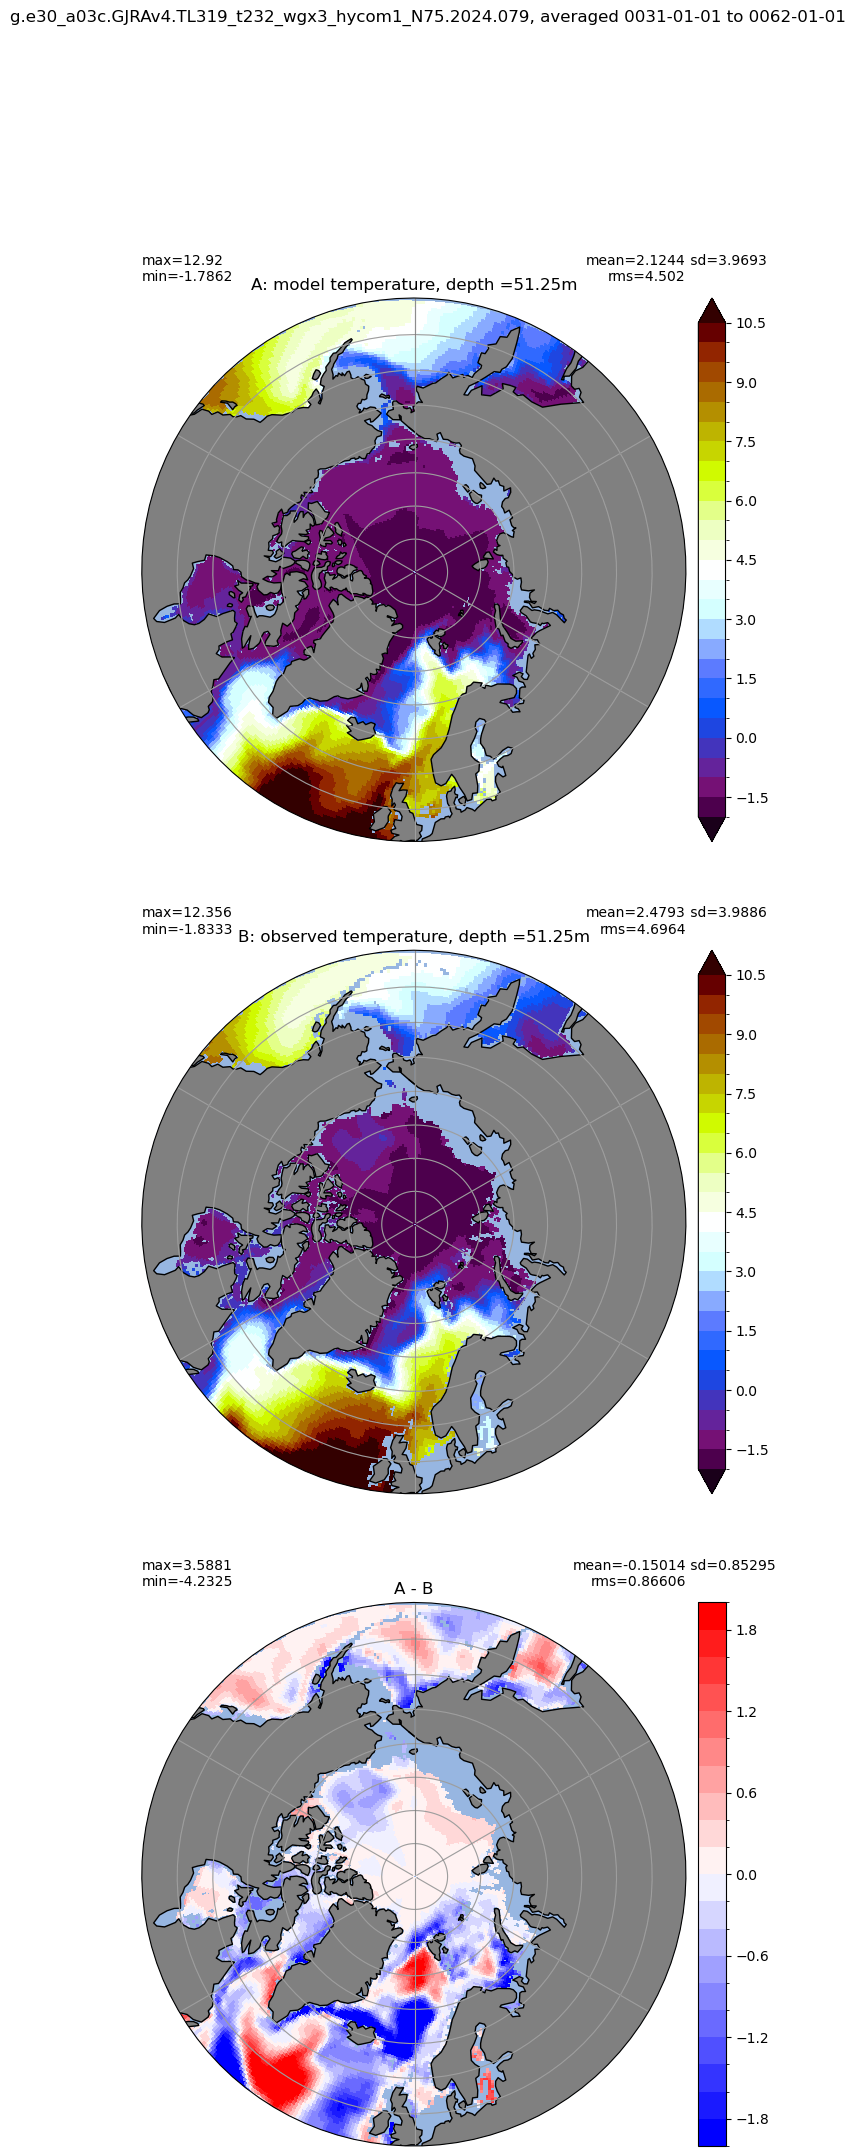
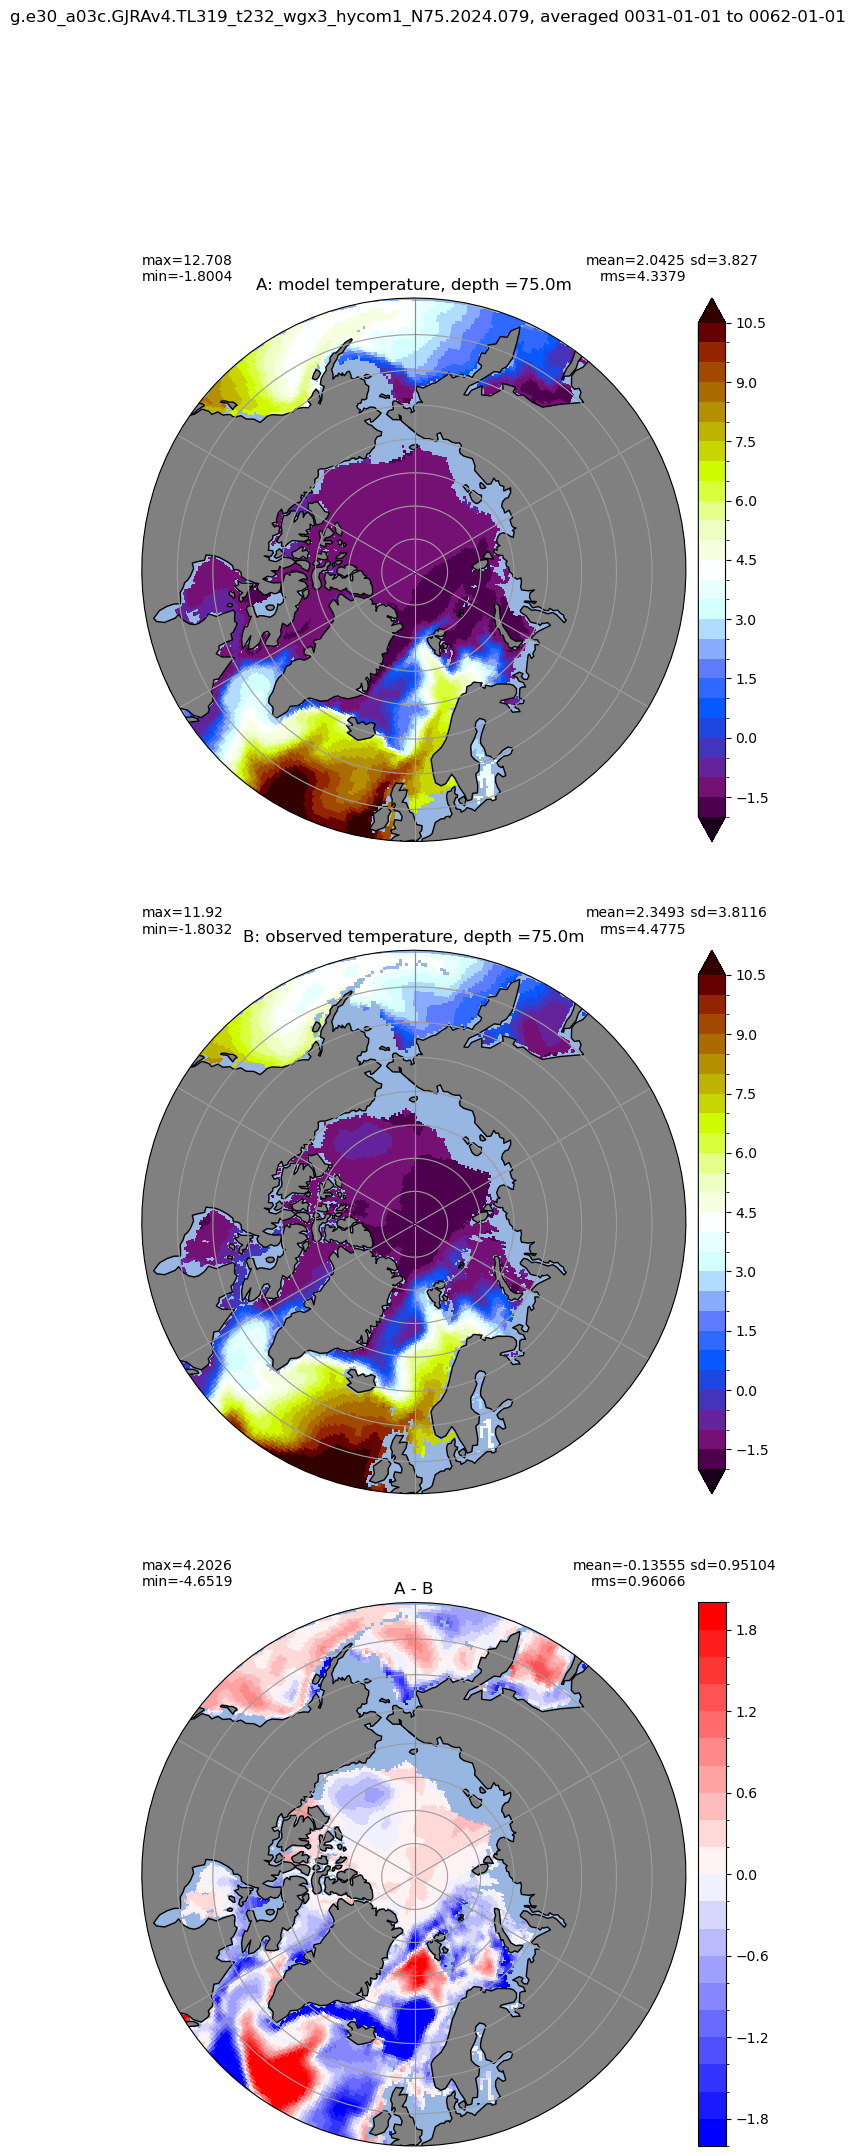
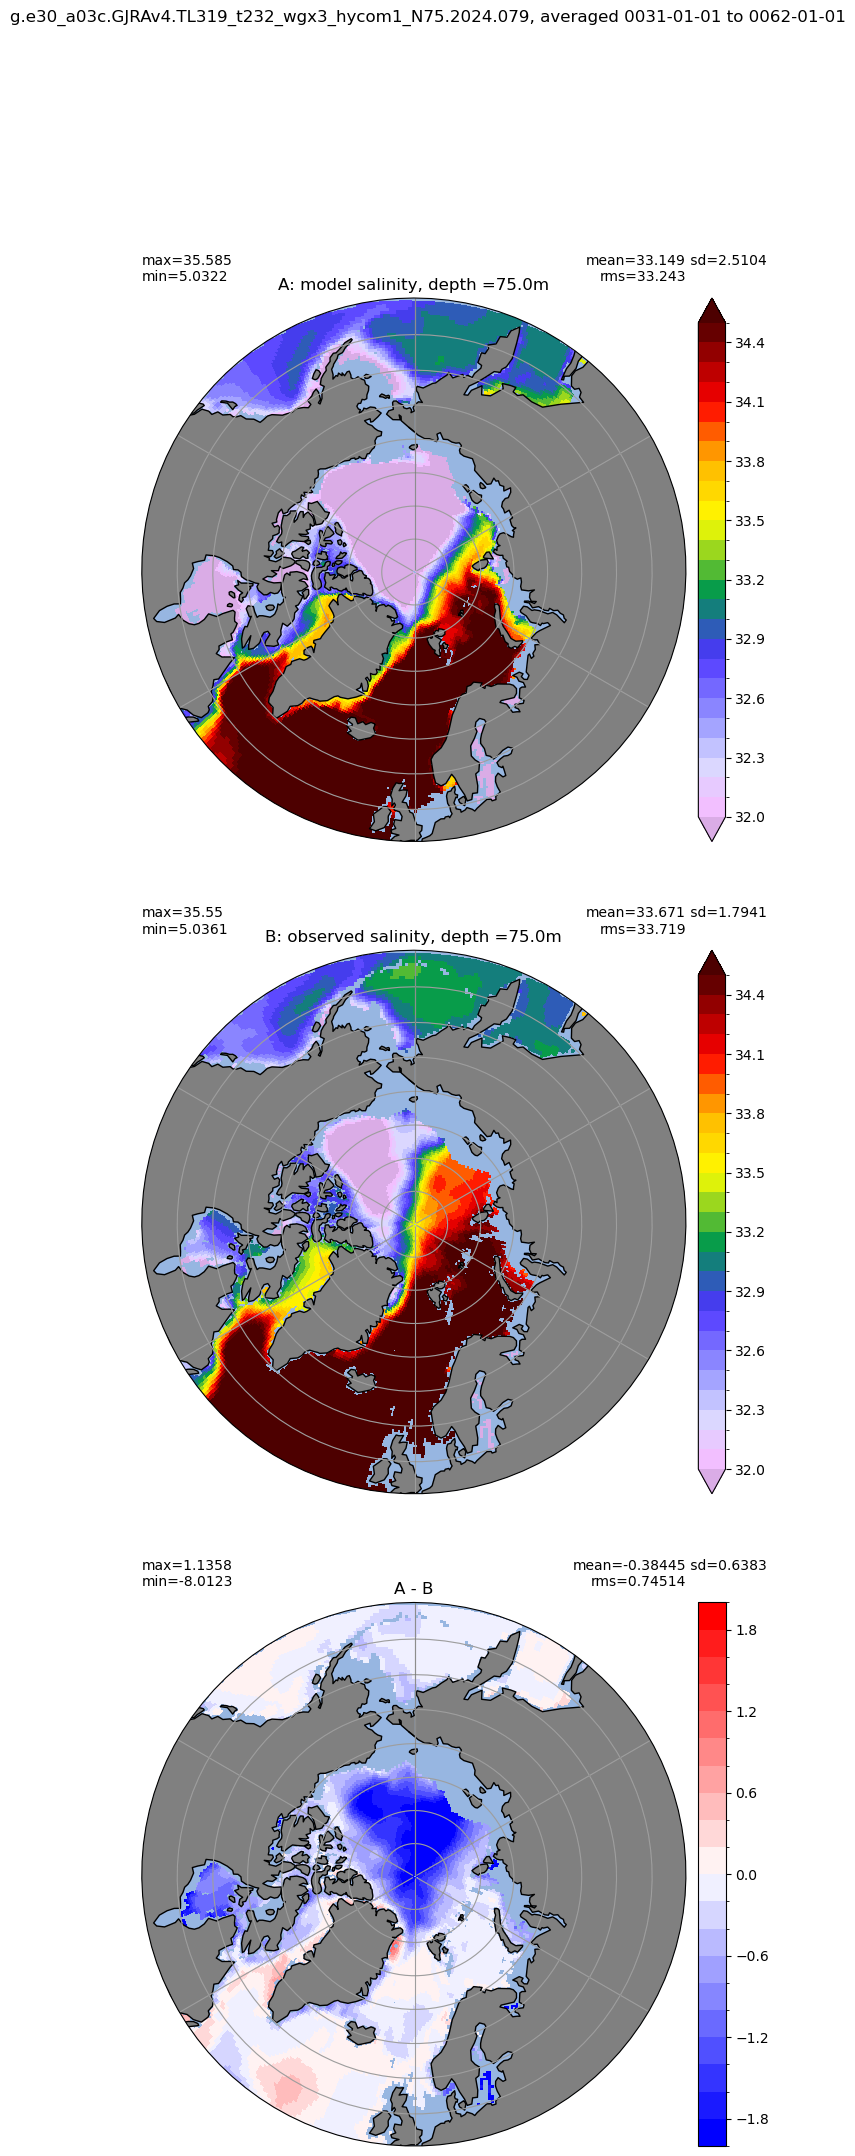
Arctic
[21]:
# loop over depths and compare TS fields
km = len(woa18['depth'])
for k in range(km):
  if (ds['z_l'][k].values < 100.):
    temp_obs = np.ma.masked_invalid(woa18['thetao'][k,:].values)
    polarcomparison(temp[k,:] , temp_obs, grd,
            title1 = 'model temperature, depth ='+str(ds['z_l'][k].values)+ 'm',
            title2 = 'observed temperature, depth ='+str(woa18['depth'][k].values)+ 'm',
            extend='both', dextend='neither', clim=(-1.9,10.5), dlim=(-2,2), dcolormap=plt.cm.bwr,
            suptitle=casename + ', averaged '+str(args.start_date)+ ' to ' +str(args.end_date),
            proj='NP', show= True)


    salt_obs = np.ma.masked_invalid(woa18['so'][k,:].values)
    polarcomparison( salt[k,:] , salt_obs, grd,
            title1 = 'model salinity, depth ='+str(ds['z_l'][k].values)+ 'm',
            title2 = 'observed salinity, depth ='+str(woa18['depth'][k].values)+ 'm',
            extend='both', dextend='neither', clim=(32.,34.5), dlim=(-2,2), dcolormap=plt.cm.bwr,
            suptitle=casename + ', averaged '+str(args.start_date)+ ' to ' +str(args.end_date),
            proj='NP', show= True)